Hi everyone,
This is my first trading idea. So, because this is the internet, feel free to criticize me in the comment section
Before we get into the short term probabilities of Bitcoins price action, let's briefly discuss / lay out certain events and correlate them to the 4hr view.
Going back to April 7th / 8th of this year, we had a 4hr oversold level on the RSi + PA which marked the local bottom of what was back then the first digestion by financial markets linked to Trumps tariffs.
23rd / 24th of June of this year, we had again a 4hr oversold level on the RSi + PA which again marked the local bottom of what as the climax of ISRAEL/IRAN conflict.
Since then we had the movement up to 118.7k then short pause and a sharp run to 123.1k.
During that time, our beloved boy Saylor tweeted "short Bitcoin if you hate money!"
If you were smart enough to realise that every time this guy posts he then proceeds to quietly offload on you, then you made some nice short gains.
Anyway, back to what most of us came here for - the short term TA perspective.
We have yet again had an event which gave financial markets a reason to unload on our heads (de risk and clean up the overextended long leveraged positions) following the Jobs report data news, which sent BTC to 111990usd area. This so far yet again posted a 4hr oversold RSi + PA and gave a bounce. Because after all, this is also previous ATH retest zone.
Later we had ISM Services PMI data, this again sent the markets into a tiny spin sending BTC to 112500usd area. Notice how the price was almost at same level as during the wick to 111990usd but RSi was notably higher?
I guess, my overall point is - in this manipulative uptrend (which isn't truly bullish really) so far, when BTC touched 4hr oversold conditions and shortly after Rsi makes higher lows, price doesn't revisit that same level again. Market digests the bad news faster than most think.
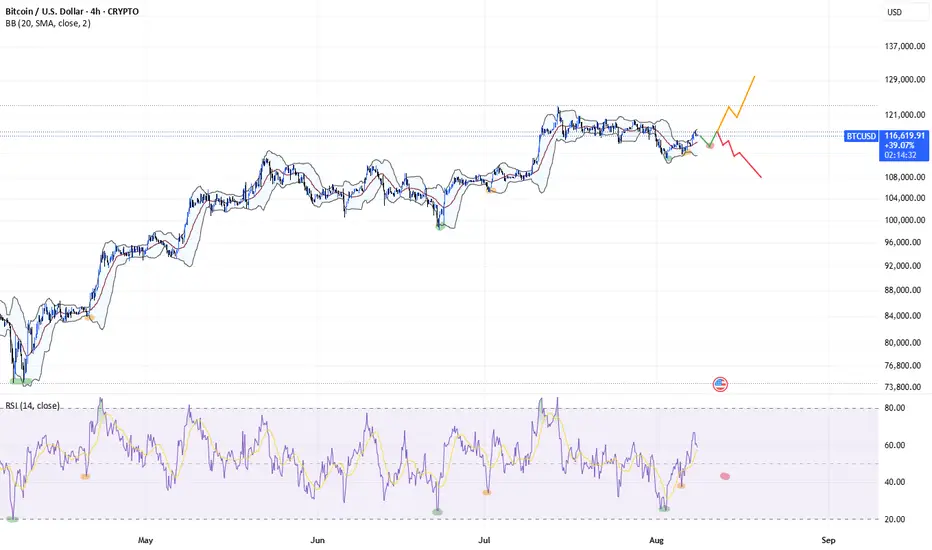
Now, on the chart I am sharing, you can see the 4hr oversold PA and RSi highlighted with a green color, the orange color for the higher low. The red color, is where I think price / rsi might go again. So maybe we retest 113.5 - 114k zone but then bounce from there to the upside.
We all trade with a certain bias, up / down or sideways.
Personally, I am trading with a bullish bias, but I also use intraday RVOL indicator, OBV and CVD (aside from PA & RSi) to confirm market intent. Tensor charts also useful to understand the orderbook a bit better.
I believe that in the next 5 days we (roughly speaking) go up from here with potential retests of the lower side of the previous FVG around 114k. Of course, if price can't stay above 115k by Sunday close, then GGs, this would likely imply short term distribution.
If we close above 115k, preferably towards 117k area, the chances of revisiting 111k will drop significantly.
Unless our dear MM friends decide to trick us again ( lol).
Final words - if this is a true bull market - we aren't revisiting 111k for a while. And if you read Arthur Hayes 100k Bitcoin call short term - then remember where he comes from.
Stay safe out there.
Also, for full transparency, I've already opened a Bitcoin long 50x at 115650usd with 2501usd margin and 4.9k usd collateral (lol!), held through this 111.9k wick and not ready to give up now.
The long I have opened, is active since 25/07/2025 and eating 70usd per day in fees. So far that's already 1k usd in fees paid.
Then again, for most this is poor risk management, but let's see.
This is my first trading idea. So, because this is the internet, feel free to criticize me in the comment section
Before we get into the short term probabilities of Bitcoins price action, let's briefly discuss / lay out certain events and correlate them to the 4hr view.
Going back to April 7th / 8th of this year, we had a 4hr oversold level on the RSi + PA which marked the local bottom of what was back then the first digestion by financial markets linked to Trumps tariffs.
23rd / 24th of June of this year, we had again a 4hr oversold level on the RSi + PA which again marked the local bottom of what as the climax of ISRAEL/IRAN conflict.
Since then we had the movement up to 118.7k then short pause and a sharp run to 123.1k.
During that time, our beloved boy Saylor tweeted "short Bitcoin if you hate money!"
If you were smart enough to realise that every time this guy posts he then proceeds to quietly offload on you, then you made some nice short gains.
Anyway, back to what most of us came here for - the short term TA perspective.
We have yet again had an event which gave financial markets a reason to unload on our heads (de risk and clean up the overextended long leveraged positions) following the Jobs report data news, which sent BTC to 111990usd area. This so far yet again posted a 4hr oversold RSi + PA and gave a bounce. Because after all, this is also previous ATH retest zone.
Later we had ISM Services PMI data, this again sent the markets into a tiny spin sending BTC to 112500usd area. Notice how the price was almost at same level as during the wick to 111990usd but RSi was notably higher?
I guess, my overall point is - in this manipulative uptrend (which isn't truly bullish really) so far, when BTC touched 4hr oversold conditions and shortly after Rsi makes higher lows, price doesn't revisit that same level again. Market digests the bad news faster than most think.
Now, on the chart I am sharing, you can see the 4hr oversold PA and RSi highlighted with a green color, the orange color for the higher low. The red color, is where I think price / rsi might go again. So maybe we retest 113.5 - 114k zone but then bounce from there to the upside.
We all trade with a certain bias, up / down or sideways.
Personally, I am trading with a bullish bias, but I also use intraday RVOL indicator, OBV and CVD (aside from PA & RSi) to confirm market intent. Tensor charts also useful to understand the orderbook a bit better.
I believe that in the next 5 days we (roughly speaking) go up from here with potential retests of the lower side of the previous FVG around 114k. Of course, if price can't stay above 115k by Sunday close, then GGs, this would likely imply short term distribution.
If we close above 115k, preferably towards 117k area, the chances of revisiting 111k will drop significantly.
Unless our dear MM friends decide to trick us again ( lol).
Final words - if this is a true bull market - we aren't revisiting 111k for a while. And if you read Arthur Hayes 100k Bitcoin call short term - then remember where he comes from.
Stay safe out there.
Also, for full transparency, I've already opened a Bitcoin long 50x at 115650usd with 2501usd margin and 4.9k usd collateral (lol!), held through this 111.9k wick and not ready to give up now.
The long I have opened, is active since 25/07/2025 and eating 70usd per day in fees. So far that's already 1k usd in fees paid.
Then again, for most this is poor risk management, but let's see.
Trade active
11/08/2025 - Crazy stress, now slightly less as position is back to almost 100% to the upside.Surviving 111990usd wick (for now) ain't no small thing when your monthly income's on the line.
But you either LOCK iN or clock in, son.
Minimum TP target is 150k BTC.
Disclaimer
The information and publications are not meant to be, and do not constitute, financial, investment, trading, or other types of advice or recommendations supplied or endorsed by TradingView. Read more in the Terms of Use.
Disclaimer
The information and publications are not meant to be, and do not constitute, financial, investment, trading, or other types of advice or recommendations supplied or endorsed by TradingView. Read more in the Terms of Use.