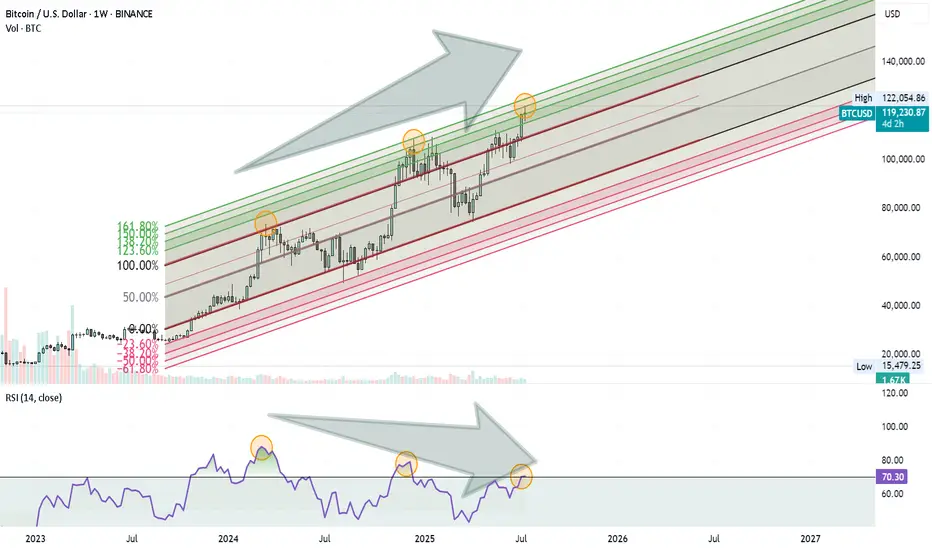
Bitcoin might be approaching a Turning Point. Here’s what I’m seeing on the weekly chart:
- Price is moving inside an ascending Fibonacci channel.
- It’s getting close to the 1.60 (160%) extension level, which has acted as a reversal zone before.
- At the same time, the RSI is showing a clear negative divergence, suggesting that momentum is weakening.
These signs combined could mean we’re not far from a significant correction.
Nothing is confirmed yet, but it’s a setup worth keeping an eye on.
Related publications
Disclaimer
The information and publications are not meant to be, and do not constitute, financial, investment, trading, or other types of advice or recommendations supplied or endorsed by TradingView. Read more in the Terms of Use.
Related publications
Disclaimer
The information and publications are not meant to be, and do not constitute, financial, investment, trading, or other types of advice or recommendations supplied or endorsed by TradingView. Read more in the Terms of Use.