All in nature resonates in ratio's and geometry is my tool to reveal the secrets that govern it's growth.
Note
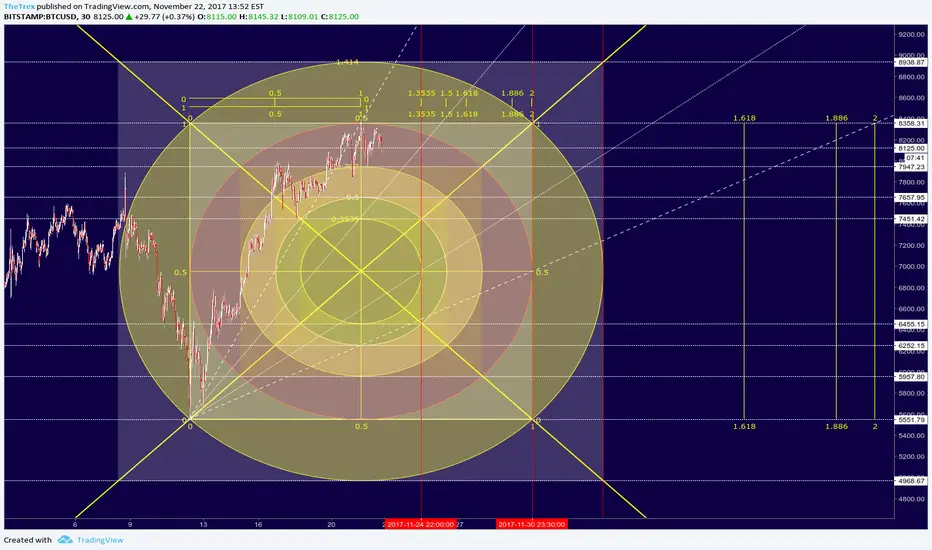
If BTC goes above 8365 it will go high 8800+Note
People ask how to read this, remember all lines are support/resistance.Note
Bitcoin looking more bullish again I expect it to retest ATHNote
Note
Hit the circle outerside!Trade active
Targets put in last pictureNote
Leaving outer circle too now! Crazy trend 8937 last resistance we could see 9300-10K next.Note
Expecting 9300+Note
Above square limit FOMO check!!Note
10200? ;)Note
I have extended the chart for higher targets, we are coming closer to important time fibs (they are in the chart) (1.886/2) Note
10K near sight. Probably within next 15HNote
Bitmex almost 10K ;)Note
1.886 was exact time of dump :)Note
I made pattern comparison if we fail to break down again it's sign of strength Note
Amazing the timefib of 2 was the bottom of this major dump! Keeps fascinating me ;)Note
Insane precision of all timefibs up to 27 days! Magic squares will be back soon. Note
So some people do not fully understand what I meant.On the original chart search for 17 December 14:00 and 19 December 17:00, these are the timefibs 1.886 and 2, exact time where trend changed from bull to bear with dump almost 25 days forecasted upfront from publish on 22 November 11:00.
I takes some skill to get these time extensions right, you have to understand how growth works, at which stage the trend is and how it extends and in which situations you can apply it.
Disclaimer
The information and publications are not meant to be, and do not constitute, financial, investment, trading, or other types of advice or recommendations supplied or endorsed by TradingView. Read more in the Terms of Use.
Disclaimer
The information and publications are not meant to be, and do not constitute, financial, investment, trading, or other types of advice or recommendations supplied or endorsed by TradingView. Read more in the Terms of Use.