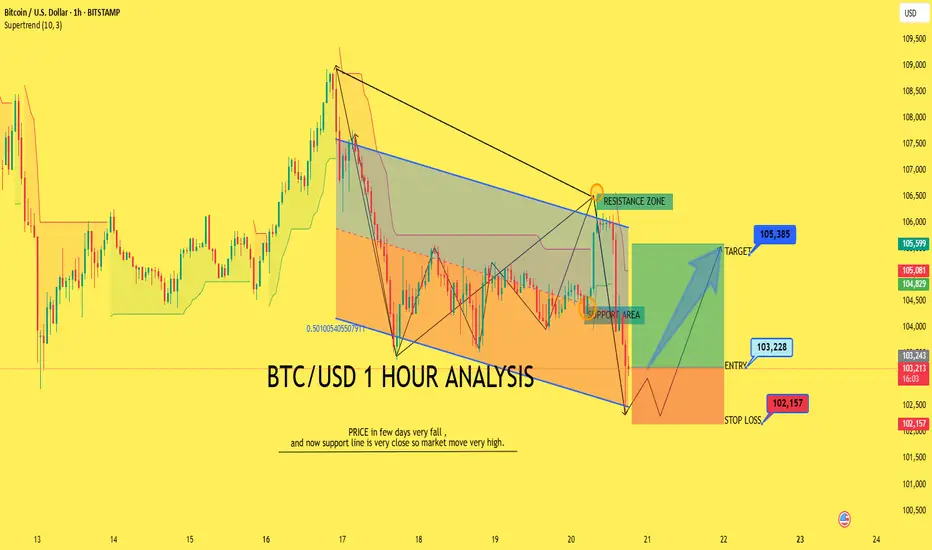
The chart shows a strong downtrend over the past few days, confirmed by :
price recently touched a key support line at the bottom of a falling wedge.
Entry point: 103,228
Target: 105,385
Stop Loss: 102,157
Analysis Summary:
Bullish Bias: the falling wedge and recent bounce from support suggest a potential bullish revrsal.
Bullish pattern suggesting potential reversal.
price bounced off the lower wedge support, showing buying interest.
A bounce from this support could trgger a breakout towards the upper wedge or beyond.
Trade closed: target reached
our chart analysis is 80% in profit and Then Stop Loss hit . now ready for next setup.Best Analysis xauusd single
t.me/+uAIef7IqwSs4M2Q0
VIP PREMIMUM ANALYSIS ROOM SIGNALS
t.me/+uAIef7IqwSs4M2Q0
t.me/+uAIef7IqwSs4M2Q0
VIP PREMIMUM ANALYSIS ROOM SIGNALS
t.me/+uAIef7IqwSs4M2Q0
Disclaimer
The information and publications are not meant to be, and do not constitute, financial, investment, trading, or other types of advice or recommendations supplied or endorsed by TradingView. Read more in the Terms of Use.
Best Analysis xauusd single
t.me/+uAIef7IqwSs4M2Q0
VIP PREMIMUM ANALYSIS ROOM SIGNALS
t.me/+uAIef7IqwSs4M2Q0
t.me/+uAIef7IqwSs4M2Q0
VIP PREMIMUM ANALYSIS ROOM SIGNALS
t.me/+uAIef7IqwSs4M2Q0
Disclaimer
The information and publications are not meant to be, and do not constitute, financial, investment, trading, or other types of advice or recommendations supplied or endorsed by TradingView. Read more in the Terms of Use.