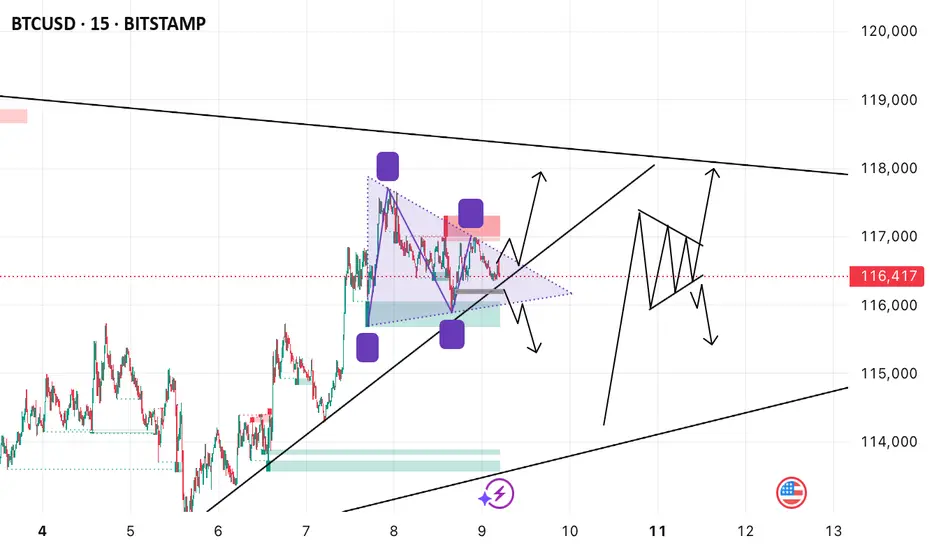
Bitcoin on the 15-minute timeframe is moving within a broad ascending channel. Price is currently around $116,331 and consolidating inside a symmetrical triangle, sitting near the channel’s lower support. There are signs of a potential bullish move, with a possible breakout aiming toward the $118,800 area, which aligns with the channel’s upper boundary. The chart also marks previous demand around $114,000, suggesting it could act as support if price drops. While the main idea leans bullish, there is a possibility of a fake breakout before moving lower, showing caution that momentum might fail.
Let’s see a breakout on either side before taking a trade.
Let’s see a breakout on either side before taking a trade.
Disclaimer
The information and publications are not meant to be, and do not constitute, financial, investment, trading, or other types of advice or recommendations supplied or endorsed by TradingView. Read more in the Terms of Use.
Disclaimer
The information and publications are not meant to be, and do not constitute, financial, investment, trading, or other types of advice or recommendations supplied or endorsed by TradingView. Read more in the Terms of Use.