Good morning, traders. I believe we are a lot more bullish than most of retail thinks at this moment. We see the dips being aggressively bought up with price still pushing higher. Everyone continues to compare the current market to 2014/15, which only results in feeding their bearish bias. As I've mentioned before, nobody is comparing price action and volume from that time period to now though.
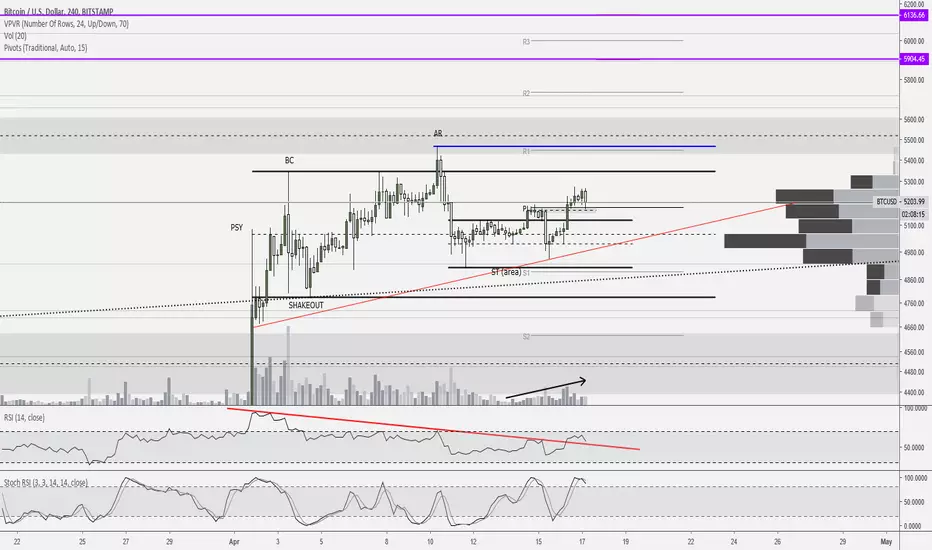
The current structure looks like what we consider to be the strongest of the reaccumulation TRs -- a reaccumulation with an uprise. As we can see, price has been printing higher highs and higher lows throughout this TR. In other words, demand continues to show up much more aggressively than supply. We can note increasing volume, since the volume lows on April 13th, as price continues to rise. Even this morning's shallow $50 shakeout caught bids at the 4H pivot. By the way, as I have mentioned numerous times before, pushing up through the bottom of the pivot is generally considered bullish and we usually look for the R1 pivot as the next immediate target. That would also put price at the TR's AR, which is within the supply zone noted.
Depending on how you define this TR (from swing high to swing low, BC to Shakeout, ascending triangle, etc.) there are essentially four targets. The two purple lines and the R3 and R4 pivots. The R3 pivot gives us a 261% extension off wave 1 which makes it a strong candidate of where price is headed at this time. However, I will potentially readjust this target depending on volume and price action leading up to it.
As long as RSI bounces off of, or otherwise remains above, the red line then we should be looking for price to rise. Alternatively, if price happens to drop below its ascending red support, then I will be looking for a Spring at the S2 pivot/demand zone. If price is rejected at the R1 pivot then I will being watching for the move down to form the Spring as well.
While 4H Stoch RSI is overbought there is still room to move up, and 1H Stoch RSI has a lot of room to run. RSI on both TFs is currently bullish with a lot of room remaining to the upside.
Every day, we have a choice to act positively or negatively, so if you get a chance, do something decent for someone today which could be as simple as sharing a nice word with them. You just might change their day, or even their life.
Remember, you can always click on the "share" button in the lower right hand of the screen, under the chart, and then click on "Make it mine" from the popup menu in order to get a live version of the chart that you can explore on your own.
Disclaimer
The information and publications are not meant to be, and do not constitute, financial, investment, trading, or other types of advice or recommendations supplied or endorsed by TradingView. Read more in the Terms of Use.
Disclaimer
The information and publications are not meant to be, and do not constitute, financial, investment, trading, or other types of advice or recommendations supplied or endorsed by TradingView. Read more in the Terms of Use.