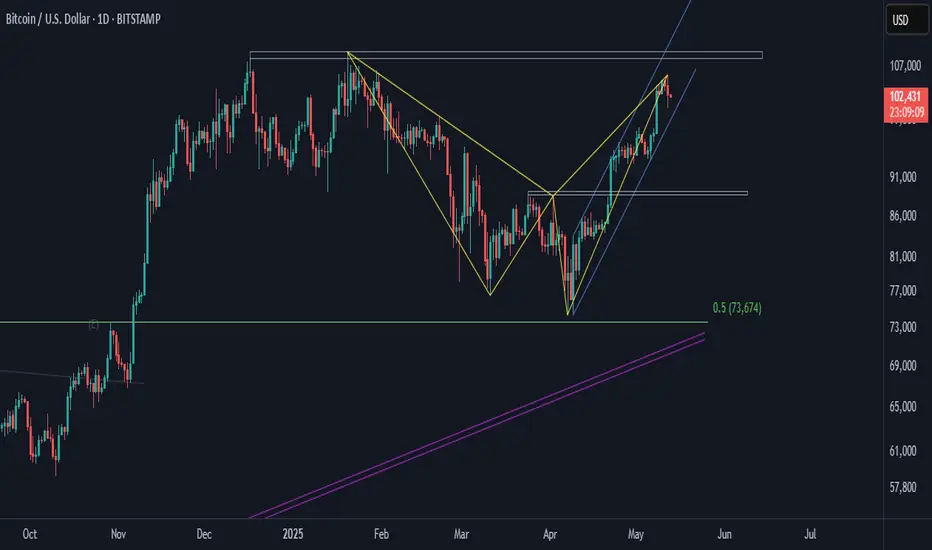
It seems a harmonic pattern has formed in the Bitcoin chart. The right leg, which is unfolding in an ascending channel, is about to finish. If Bitcoin breaks this channel downward, that means the 89K area is going to be the first target. Let's see what happens.
For long-term analysis of Bitcoin, see the related links.
For long-term analysis of Bitcoin, see the related links.
Note
So, Bitcoin reached the ascending channel's lower line. Would the previous behaviour repeat, and would Bitcoin go up? Or would it break the channel downward, and the correction start? Let's see what happens.
Note
So, it seems Bitcoin is trying to break the triangular consolidation area upward. If Bitcoin goes up and breaks the horizontal resistance area, the harmonic pattern scenario becomes invalid. Let's see what happens.
Note
So, even though Bitcoin's price increased, the harmonic pattern remained valid. Price broke the right leg's channel and started going down. There are two possible targets: 93K and 88K areas. Let's see on which one Bitcoin bounces off. Let's see what happens.
Note
So, as it turned out, a Cup and Handle pattern was unfolding. The handle part is almost finished. This week's candle needs to break above the descending channel, the Handle, and close above the upper line to confirm the breakout. Let's see what happens.
Related publications
Disclaimer
The information and publications are not meant to be, and do not constitute, financial, investment, trading, or other types of advice or recommendations supplied or endorsed by TradingView. Read more in the Terms of Use.
Related publications
Disclaimer
The information and publications are not meant to be, and do not constitute, financial, investment, trading, or other types of advice or recommendations supplied or endorsed by TradingView. Read more in the Terms of Use.