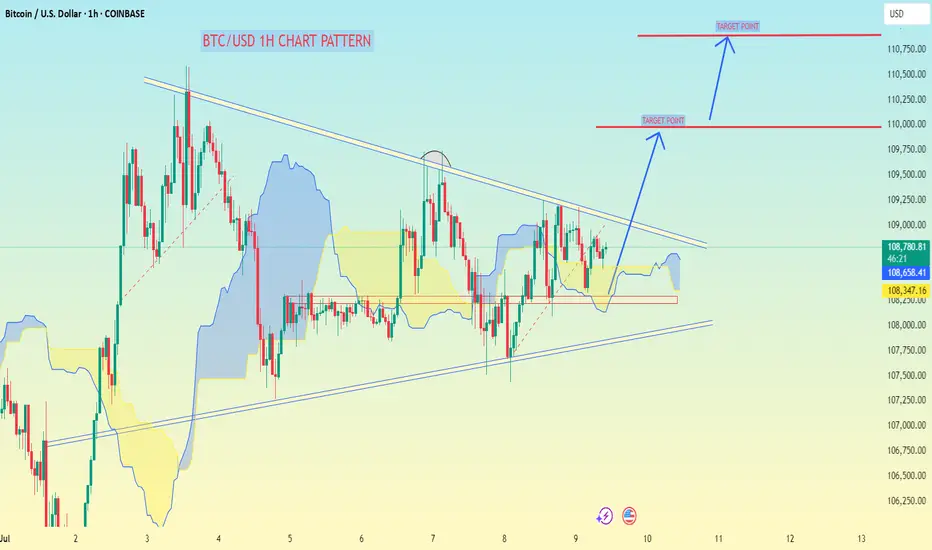
BTC/USD 1H chart I shared, the chart shows a bullish breakout pattern forming (likely a symmetrical triangle breakout).
Target Points Identified:
1. First Target:
📍 109,750 USD
2. Second Target:
📍 110,750 USD
---
Key Notes:
Breakout above the descending trendline signals a bullish move.
Ichimoku cloud is thinning, suggesting possible momentum if price breaks upward.
Make sure to confirm the breakout with strong volume.
Let me know if you want stop-loss levels or a detailed trade setup.
Trade active
trade activeTrade closed: target reached
target doneNote
t.me/+yJ2-qfkocRg1NDlk
Forex, gold and crypto signal's with detailed analysis & get consistent results..
t.me/Jhonscalpertrade11
Gold signal's with proper TP & SL for high profits opportunities..
Forex, gold and crypto signal's with detailed analysis & get consistent results..
t.me/Jhonscalpertrade11
Gold signal's with proper TP & SL for high profits opportunities..
Related publications
Disclaimer
The information and publications are not meant to be, and do not constitute, financial, investment, trading, or other types of advice or recommendations supplied or endorsed by TradingView. Read more in the Terms of Use.