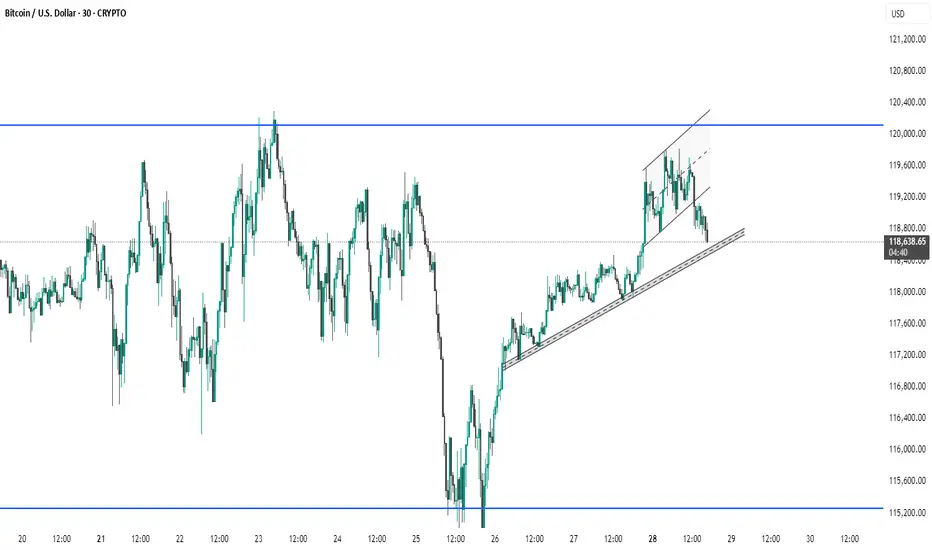
The chart shows Bitcoin (BTC/USD) on a 30-minute timeframe. Price recently broke down from a rising channel and is currently testing a key ascending trendline for support around $118,600. A break below this trendline could signal further downside, while a bounce may lead to another test of the $120,000 resistance level. Traders should watch closely for a confirmed move below or a reversal signal at this support zone.
Related publications
Disclaimer
The information and publications are not meant to be, and do not constitute, financial, investment, trading, or other types of advice or recommendations supplied or endorsed by TradingView. Read more in the Terms of Use.
Related publications
Disclaimer
The information and publications are not meant to be, and do not constitute, financial, investment, trading, or other types of advice or recommendations supplied or endorsed by TradingView. Read more in the Terms of Use.