Current Price: $117,755
Trend: Recently bullish, now facing a potential correction
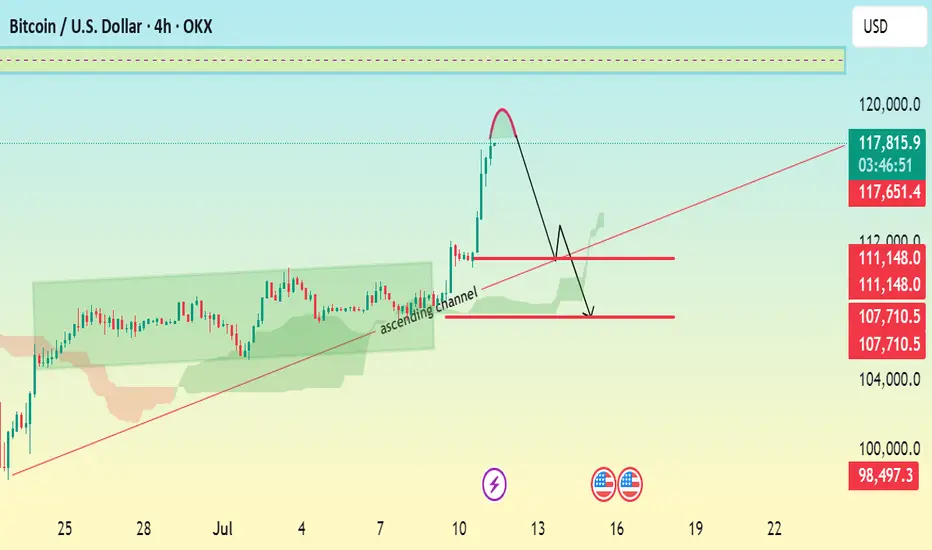
Chart Pattern: Breakout above ascending channel, followed by a sharp projected correction.
🔍 Technical Breakdown:
> Ascending Channel:
Price was respecting an ascending channel (highlighted in green).
A bullish breakout occurred with strong momentum.
> Sharp Rejection & Correction Setup:
After the breakout, a steep rally seems to have peaked.
The red curved arrow suggests a completed bullish impulse, now setting up for a bearish correction.
> Key Levels:
Resistance Zone: $118,000 – $120,000
Immediate Support: $111,150
Next Major Support: $107,700
Bearish Target Support: $105,945
🎯 Trade Setup Suggestion:
Short Entry Zone: Around $111,150 if price gets rejected there.
Target: $105,945
Stop-Loss: Above $112,000 (tight risk control)
Trend: Recently bullish, now facing a potential correction
Chart Pattern: Breakout above ascending channel, followed by a sharp projected correction.
🔍 Technical Breakdown:
> Ascending Channel:
Price was respecting an ascending channel (highlighted in green).
A bullish breakout occurred with strong momentum.
> Sharp Rejection & Correction Setup:
After the breakout, a steep rally seems to have peaked.
The red curved arrow suggests a completed bullish impulse, now setting up for a bearish correction.
> Key Levels:
Resistance Zone: $118,000 – $120,000
Immediate Support: $111,150
Next Major Support: $107,700
Bearish Target Support: $105,945
🎯 Trade Setup Suggestion:
Short Entry Zone: Around $111,150 if price gets rejected there.
Target: $105,945
Stop-Loss: Above $112,000 (tight risk control)
📲 Join telegram channel free ..
t.me/docter_Pips_official05
Forex, Gold & Crypto Signals with detailed analysis & get consistent results..
t.me/docter_Pips_official05
Gold Signal's with proper TP & SL for high profit.
t.me/docter_Pips_official05
Forex, Gold & Crypto Signals with detailed analysis & get consistent results..
t.me/docter_Pips_official05
Gold Signal's with proper TP & SL for high profit.
Disclaimer
The information and publications are not meant to be, and do not constitute, financial, investment, trading, or other types of advice or recommendations supplied or endorsed by TradingView. Read more in the Terms of Use.