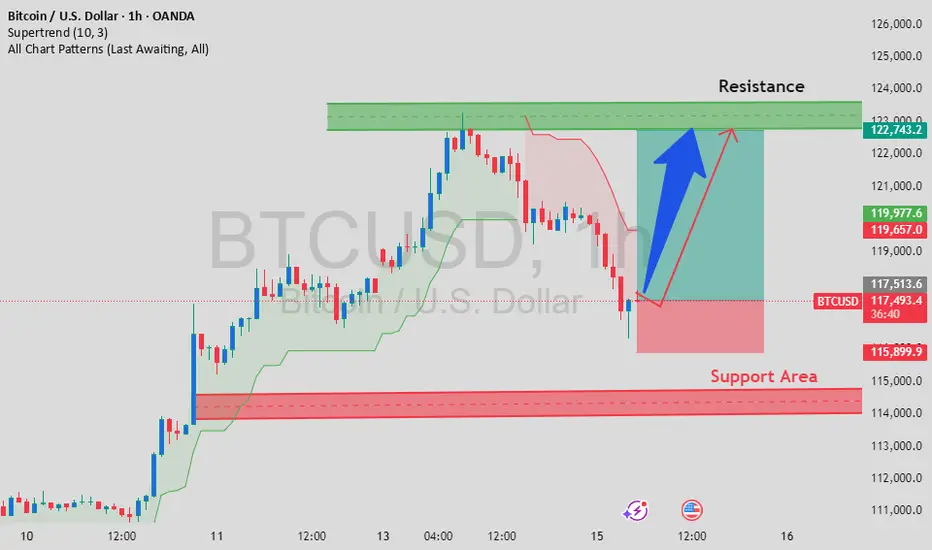
The chart shows a potential bullish setup forming for Bitcoin (BTC/USD) on the 1-hour timeframe. After a pullback from the resistance zone near $122,743, price action is approaching a key support area around $115,900 – $117,000. A bounce from this zone could indicate a potential reversal or continuation of the overall uptrend.
Key Levels:
Support Area: $116,000 – $117,000
Resistance Zone: $122,000 – $123,000
Supertrend Indicator: Currently bearish, a break above $119,657 may flip the trend bullish again.
Possible Scenario:
A bullish reversal from the support area may lead to a retest of the resistance zone. Watch for confirmation signals such as bullish candlestick patterns or a break above the supertrend level before considering long entries.
join my channel for More live updates
t.me/+JpxuUQsPicA4NjVk
My Free Channel
t.me/+vk8eNn-R7A9kZDNk
t.me/+JpxuUQsPicA4NjVk
My Free Channel
t.me/+vk8eNn-R7A9kZDNk
Disclaimer
The information and publications are not meant to be, and do not constitute, financial, investment, trading, or other types of advice or recommendations supplied or endorsed by TradingView. Read more in the Terms of Use.