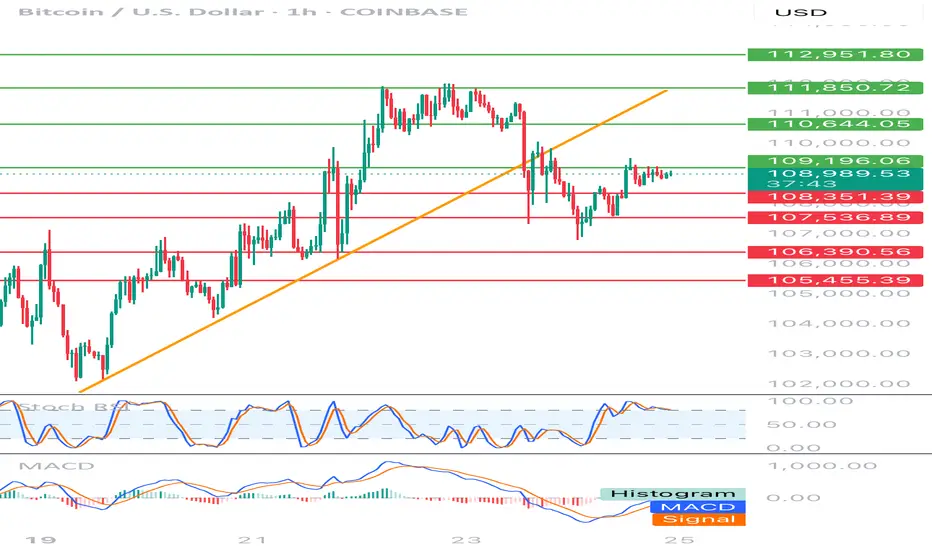
Hello everyone, let's look at the 1H BTC chart to USD, in this situation we can see how the price dropped below the local upward trend line. Going further, let's check the places of potential target for the price:
T1 = 109196 $
T2 = 110644 $
Т3 = 111850 $ t4 = 112951 $
Let's go to Stop-Loss now in case of further declines on the market:
SL1 = 108351 $
SL2 = 107537 $
SL3 = 106390 $
SL4 = 105455 $
Looking at the RSI indicator, we see staying over the upper limit, which can give price drops, while the MacD indicator lasts at the bottom of the range and is close to returning to the upward trend.
Disclaimer
The information and publications are not meant to be, and do not constitute, financial, investment, trading, or other types of advice or recommendations supplied or endorsed by TradingView. Read more in the Terms of Use.
Disclaimer
The information and publications are not meant to be, and do not constitute, financial, investment, trading, or other types of advice or recommendations supplied or endorsed by TradingView. Read more in the Terms of Use.