Analysis of the BTC/USD 4‑Hour Chart
From the chart you provided, here's how the technical situation looks:
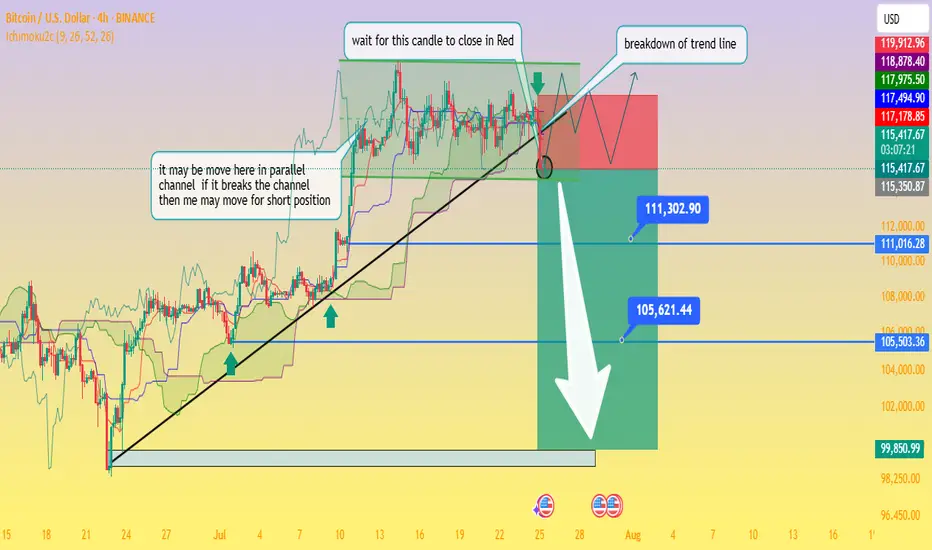
Ascending trendline support has been tested multiple times and was recently breached this afternoon, signaling a possible shift from the bullish setup to a bearish continuation.
The price is now trapped within a descending triangle formation beneath a well‑defined swing high resistance zone. This reflects indecision in the market, with neither buyers nor sellers in clear control
Business Insider
+15
Fxglory Ltd
+15
Bitcoin News
+15
.
Key levels to monitor:
Support zone: ~$115,500, extending down to ~$111,300 and ~$105,600 as deeper targets if bearish momentum strengthens.
Resistance zone: ~$119,000–120,000 area, forming strong overhead supply
Economies.com
DailyForex
Bitcoin News
.
The chart’s annotations align with a classic breakout strategy—with the caveat: wait for a confirmed close below the trendline before considering short positions (as noted in your “wait for this candle to close in red” comment).
Breakout confirmation would likely pave the way toward your indicated profit zones near ~$111k and ~$105k, with a larger potential down to ~$99.8k if further downside pressure builds.
🔍 What the Broader Market Signals
Technical sentiment from sources covering today’s analysis shows BTC/USD hovering just under $120,000, stuck within the defined range of $115.5k support to $120k resistance
Economies.com
.
While there’s still neutral momentum in indicators like RSI and MACD, the short-term direction leans bearish if the breakdown is confirmed on the H4 timeframe
Fxglory Ltd
.
Analysts emphasize that sustained movement above $116.5k could retarget resistance near $119–120k. A failure there and a move below $115.5k may thrust price deeper toward your downside zones
DailyForex
.
✅ Trading Strategy Overview
Scenario Trigger Target Levels
Bearish Breakdown H4 candle closes below trendline ~$115.5k $111.3k → $105.6k → possible $99.8k zone
Bullish Rejection Bounce back above ~$116.5k and trending above resistance $119k–120k retest, potential breakout if sustained
Neutral / Wait-and-see No decisive candle close yet Hold for confirmation
⛳ Final Thoughts
chart highlights a critical point: don’t act prematurely. Wait for a decisive H4 candle close below the trendline before committing to shorts. Confirmed bearish action around the breakout could open the path to the lower targets you identified. However, if price rebounds above support and climbs above $116.5k, a short-term retest of $119k–120k is still in range.
Traders should maintain prudent risk management—watching the unfolding price action around these pivot points without overreaching. Let me know if you'd like help crafting entry/exit zones or risk profiles for this setup!
From the chart you provided, here's how the technical situation looks:
Ascending trendline support has been tested multiple times and was recently breached this afternoon, signaling a possible shift from the bullish setup to a bearish continuation.
The price is now trapped within a descending triangle formation beneath a well‑defined swing high resistance zone. This reflects indecision in the market, with neither buyers nor sellers in clear control
Business Insider
+15
Fxglory Ltd
+15
Bitcoin News
+15
.
Key levels to monitor:
Support zone: ~$115,500, extending down to ~$111,300 and ~$105,600 as deeper targets if bearish momentum strengthens.
Resistance zone: ~$119,000–120,000 area, forming strong overhead supply
Economies.com
DailyForex
Bitcoin News
.
The chart’s annotations align with a classic breakout strategy—with the caveat: wait for a confirmed close below the trendline before considering short positions (as noted in your “wait for this candle to close in red” comment).
Breakout confirmation would likely pave the way toward your indicated profit zones near ~$111k and ~$105k, with a larger potential down to ~$99.8k if further downside pressure builds.
🔍 What the Broader Market Signals
Technical sentiment from sources covering today’s analysis shows BTC/USD hovering just under $120,000, stuck within the defined range of $115.5k support to $120k resistance
Economies.com
.
While there’s still neutral momentum in indicators like RSI and MACD, the short-term direction leans bearish if the breakdown is confirmed on the H4 timeframe
Fxglory Ltd
.
Analysts emphasize that sustained movement above $116.5k could retarget resistance near $119–120k. A failure there and a move below $115.5k may thrust price deeper toward your downside zones
DailyForex
.
✅ Trading Strategy Overview
Scenario Trigger Target Levels
Bearish Breakdown H4 candle closes below trendline ~$115.5k $111.3k → $105.6k → possible $99.8k zone
Bullish Rejection Bounce back above ~$116.5k and trending above resistance $119k–120k retest, potential breakout if sustained
Neutral / Wait-and-see No decisive candle close yet Hold for confirmation
⛳ Final Thoughts
chart highlights a critical point: don’t act prematurely. Wait for a decisive H4 candle close below the trendline before committing to shorts. Confirmed bearish action around the breakout could open the path to the lower targets you identified. However, if price rebounds above support and climbs above $116.5k, a short-term retest of $119k–120k is still in range.
Traders should maintain prudent risk management—watching the unfolding price action around these pivot points without overreaching. Let me know if you'd like help crafting entry/exit zones or risk profiles for this setup!
Join My telegram channel Free:
t.me/tamesbulltarder139
💎
VIP Channels:
Forex:+400Pips & Crypto +420% monthly profit at VIP.
check pinned message in telegram for more information.
t.me/tamesbulltarder139
💎
VIP Channels:
Forex:+400Pips & Crypto +420% monthly profit at VIP.
check pinned message in telegram for more information.
Related publications
Disclaimer
The information and publications are not meant to be, and do not constitute, financial, investment, trading, or other types of advice or recommendations supplied or endorsed by TradingView. Read more in the Terms of Use.