Here's another little viewpoint you might not have thought much about before.
Trading patterns is more popular than you would believe. Some seem to think it's magic or some kind of secret.
The issue is people tend to get fixated on the wrong things, such as the exact Fibonacci relationships and so on.
Let me show you something to simplify the concept, regardless of the pattern.
Example:
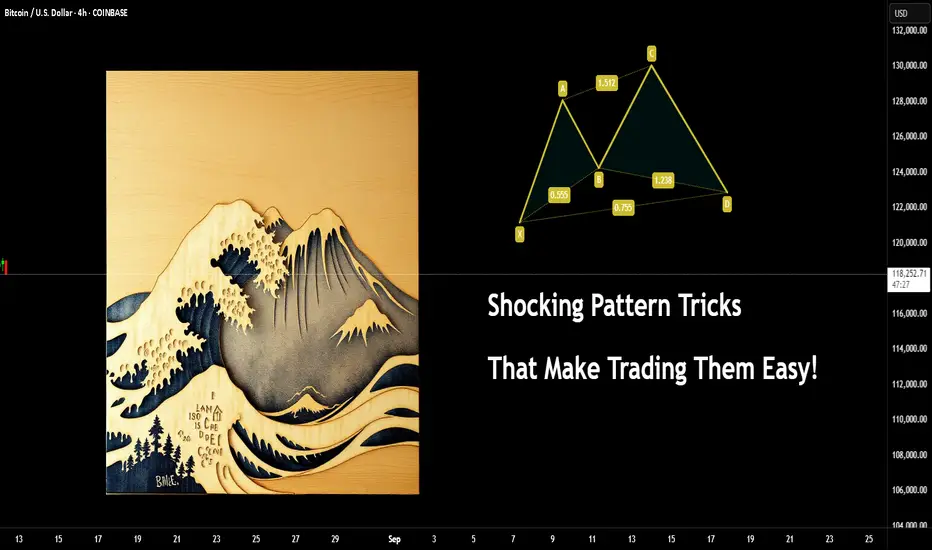
You might have seen a Crab pattern?

What you would then expect after spotting one on the chart is a move like this.

But, have you ever stopped to think what the price action is actually saying? It has ZERO to do with Fib relations.
Think of what the trend is doing

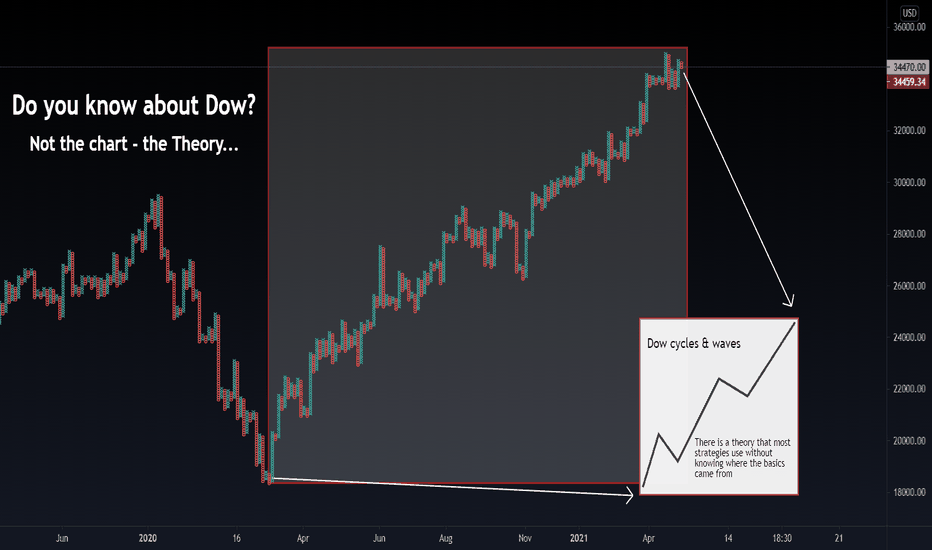
I have covered the basics of Dow theory in several posts here. An example of such a post is here (you need to click the image to see the full post).
Ok, Now you can see it's only part of a higher degree wave count. Let's add an example of liquidity and a range.

Are you starting to see it already?
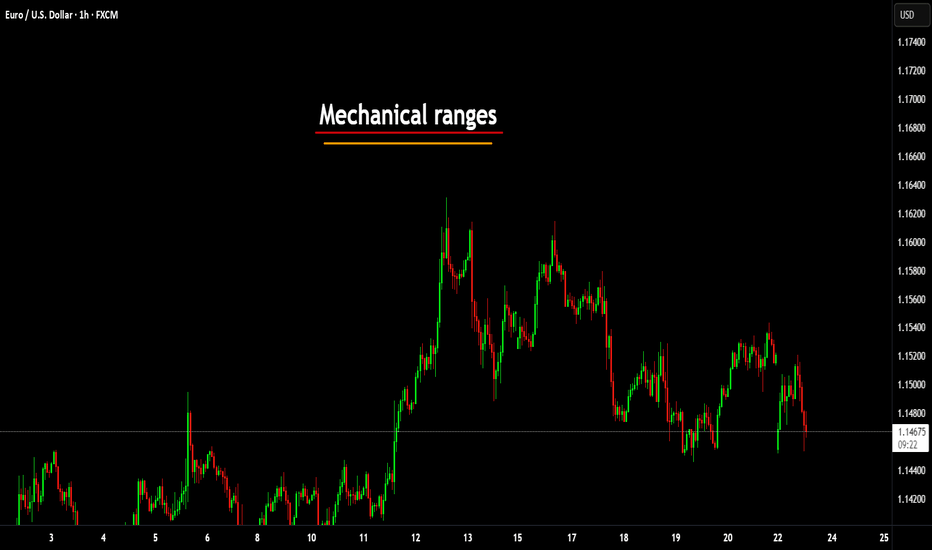
Here's a post on the ranges...
Change the pattern from a Crab to a Bat.

Now look at it and logically what is the chart behind the pattern saying? Both bullish and bearish versions.
What about the good, old head and shoulders technique?

If you are unsure about the pattern, it's market something like this
(examples only) don't comment something like "the levels are wrong" all of these were freehand to show the concept without accuracy.
Looking at the H&S pattern - you can actually see the logic simplified.

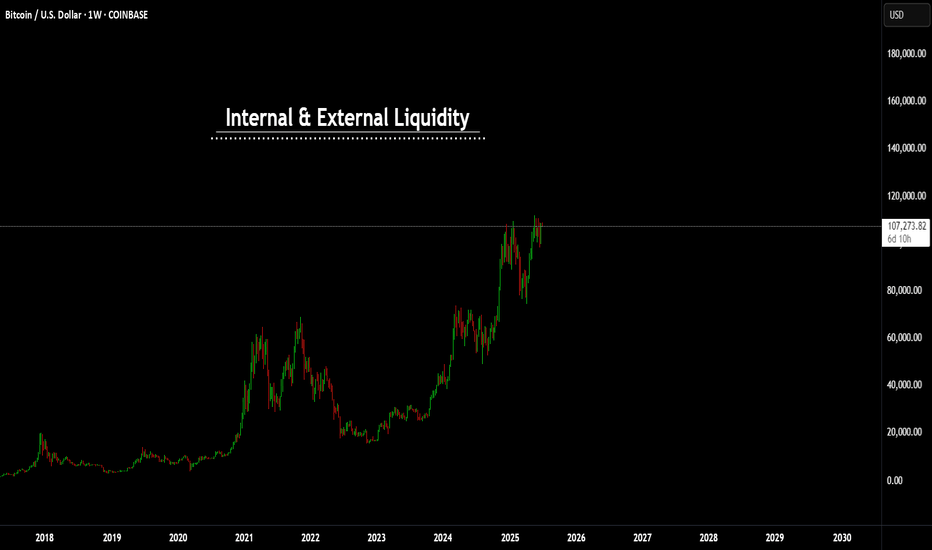
Again, if you don't know about internal and external liquidity, here's another post on the topic.
What happens next is the internal structure changes, which then eventually leads to the higher TF change of structure.

And if you were to follow either Fib levels or Elliott Wave counts you will notice the regular move internally looks similar. (marked in red).

This post is just to show you an example and how obvious these can be.
Once you learn the basics, you won't need the complex version to follow price and use this to your advantage.
Have a great week!
Disclaimer
This idea does not constitute as financial advice. It is for educational purposes only, our principal trader has over 25 years' experience in stocks, ETF's, and Forex. Hence each trade setup might have different hold times, entry or exit conditions, and will vary from the post/idea shared here. You can use the information from this post to make your own trading plan for the instrument discussed. Trading carries a risk; a high percentage of retail traders lose money. Please keep this in mind when entering any trade. Stay safe.
Trading patterns is more popular than you would believe. Some seem to think it's magic or some kind of secret.
The issue is people tend to get fixated on the wrong things, such as the exact Fibonacci relationships and so on.
Let me show you something to simplify the concept, regardless of the pattern.
Example:
You might have seen a Crab pattern?
What you would then expect after spotting one on the chart is a move like this.
But, have you ever stopped to think what the price action is actually saying? It has ZERO to do with Fib relations.
Think of what the trend is doing
I have covered the basics of Dow theory in several posts here. An example of such a post is here (you need to click the image to see the full post).
Ok, Now you can see it's only part of a higher degree wave count. Let's add an example of liquidity and a range.
Are you starting to see it already?
Here's a post on the ranges...
Change the pattern from a Crab to a Bat.
Now look at it and logically what is the chart behind the pattern saying? Both bullish and bearish versions.
What about the good, old head and shoulders technique?
If you are unsure about the pattern, it's market something like this
(examples only) don't comment something like "the levels are wrong" all of these were freehand to show the concept without accuracy.
Looking at the H&S pattern - you can actually see the logic simplified.
Again, if you don't know about internal and external liquidity, here's another post on the topic.
What happens next is the internal structure changes, which then eventually leads to the higher TF change of structure.
And if you were to follow either Fib levels or Elliott Wave counts you will notice the regular move internally looks similar. (marked in red).
This post is just to show you an example and how obvious these can be.
Once you learn the basics, you won't need the complex version to follow price and use this to your advantage.
Have a great week!
Disclaimer
This idea does not constitute as financial advice. It is for educational purposes only, our principal trader has over 25 years' experience in stocks, ETF's, and Forex. Hence each trade setup might have different hold times, entry or exit conditions, and will vary from the post/idea shared here. You can use the information from this post to make your own trading plan for the instrument discussed. Trading carries a risk; a high percentage of retail traders lose money. Please keep this in mind when entering any trade. Stay safe.
Discord Server for education and advanced techniques: discord.gg/5t3w47raHe
Masterclass Webinar: mayfairtradingevents.com
Prop firm partners (FTMO)
shorturl.at/hBEQ4
Masterclass Webinar: mayfairtradingevents.com
Prop firm partners (FTMO)
shorturl.at/hBEQ4
Related publications
Disclaimer
The information and publications are not meant to be, and do not constitute, financial, investment, trading, or other types of advice or recommendations supplied or endorsed by TradingView. Read more in the Terms of Use.