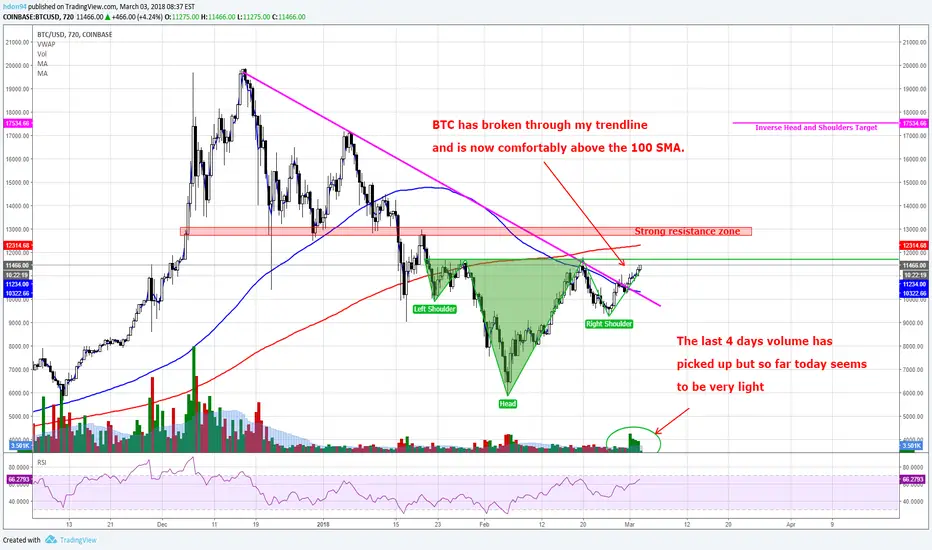
BTC looks to be forming an inverse Head and Shoulders pattern, (Coinbase 12 hour time frame). This will be a big test for BTC, Bitcoin has struggled since late January to push above $11,800. We will know shortly if this time it can break through that level. One thing that concerns me is that it looks as though the volume is dropping off, I would hope to see the opposite as BTC gets closer to this resistance area.
Even if BTC can break above the neckline it faces another huge test, a combination of the 200 SMA and a very strong resistance zone that it must push through.
Even if BTC can break above the neckline it faces another huge test, a combination of the 200 SMA and a very strong resistance zone that it must push through.
Disclaimer
The information and publications are not meant to be, and do not constitute, financial, investment, trading, or other types of advice or recommendations supplied or endorsed by TradingView. Read more in the Terms of Use.
Disclaimer
The information and publications are not meant to be, and do not constitute, financial, investment, trading, or other types of advice or recommendations supplied or endorsed by TradingView. Read more in the Terms of Use.