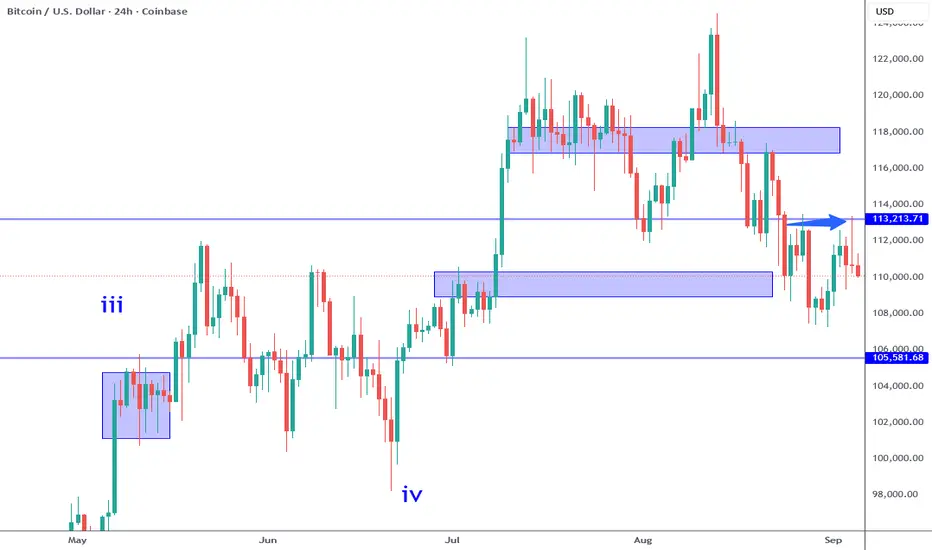
Bitcoin has rejected the 113K as a resistance with a clear bearish pin bar close. The low of that pin bar has been broken which qualifies as a sell signal on the daily time frame. 113K was previously a key support, and now a resistance which further adds to the broader corrective argument that I have been writing about for weeks. So what does this mean?
The next support is the 105K area and that is where I am anticipating a test either this week or next. Besides CPI, this month also features the next FOMC meeting which can act as a major catalyst bullish OR bearish. These economic events are big enough to affect Bitcoin in a major way which makes it within reason to test the 105K area. IF 105K breaks, the next support after that is the 102 to 100K area.
These support references serve as important potential pivot points for day trades and swing trades. You have to evaluation the price action for reversals along with utilizing a realistic reward/risk framework. For example, since Bitcoin has proven to no longer be in an impulse wave (trend) it is more likely in a consolidation. In practice this means LOWER expectations are warranted. Instead of placing take profit objectives on highs or new highs, it is within reason to choose a higher probability objective like 1:1 or whatever the next resistance is at the time of the reversal. Like 113K can be used as a resistance for a profit objective now (UNTIL OR UNLESS IT BREAKS).
Using wave counts helps immensely when it comes to forming expectations that are in line with market intent. Since the 108K overlap I am anticipating more of a range bound type of environment which means both RANGE support and resistance levels are significant. This is in contrast to expecting the market to continue to trend which is a common mistake among the less experienced. This thought framework is relevant to swing trades and day trades as the market character changes more frequently over shorter time frames. Even as an investor, the wave counts can help you to recognize much higher quality buying opportunities rather than buying at any price.
Thank you for considering my analysis and perspective.
I hosted ICTC 2025: whitebit.com/m/ICTC-2025
Try Trade Scanner Pro for FREE: bit.ly/TSCPRO
LIVE Day Trades: youtube.com/@marcpmarkets.signals
Watch Full Trade Scanner Pro Tutorial: youtu.be/fdFLhLnqM9A
Try Trade Scanner Pro for FREE: bit.ly/TSCPRO
LIVE Day Trades: youtube.com/@marcpmarkets.signals
Watch Full Trade Scanner Pro Tutorial: youtu.be/fdFLhLnqM9A
Related publications
Disclaimer
The information and publications are not meant to be, and do not constitute, financial, investment, trading, or other types of advice or recommendations supplied or endorsed by TradingView. Read more in the Terms of Use.