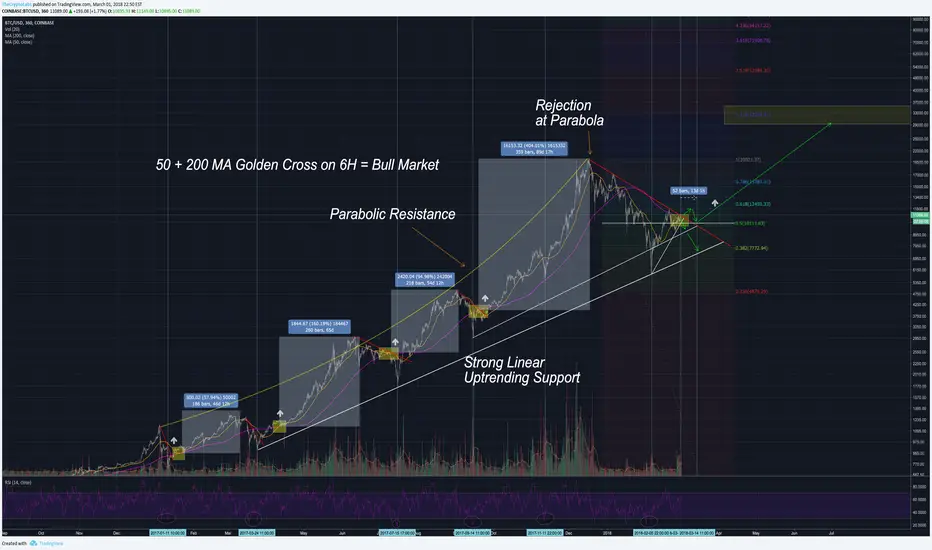
50 + 200MA golden cross on 6h has been reliable indicator for bull market.
previous parabolic resistance drawn by curved yellow line.
up trending support drawn by white line.
yellow boxes: golden crosses.
red downtrend line: resistance, price to break to, by textbook, enter a bull market.
RSI draws bottoms.
previous parabolic resistance drawn by curved yellow line.
up trending support drawn by white line.
yellow boxes: golden crosses.
red downtrend line: resistance, price to break to, by textbook, enter a bull market.
RSI draws bottoms.
Note
title was supposed to be june - july.Note
$30,000 - $60,000 Q4 2018 target.Disclaimer
The information and publications are not meant to be, and do not constitute, financial, investment, trading, or other types of advice or recommendations supplied or endorsed by TradingView. Read more in the Terms of Use.
Disclaimer
The information and publications are not meant to be, and do not constitute, financial, investment, trading, or other types of advice or recommendations supplied or endorsed by TradingView. Read more in the Terms of Use.