Update on previous idea attached.
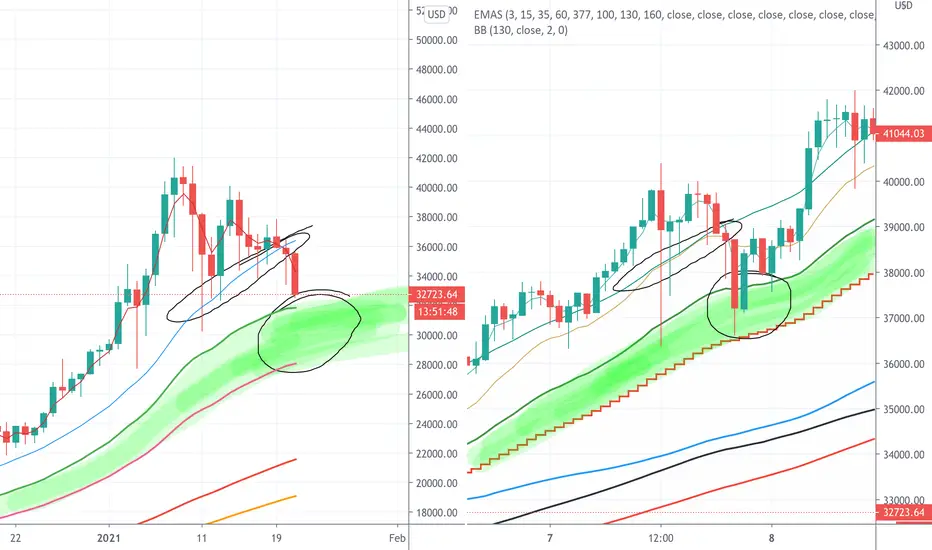
On the left daily chart of bitcoin now. It broke below bolinger band support and going down to green scd band.
On the right 1hr chart - works the same , only amplitude smaller. Breaking below bolinger support and decline in to green scd band then bounce back up.
Can you see they look a like?
This kind of reaction i am looking for on daily now.
From now level it can drop or it can take off to 38000 to retest top bolinger on daily. It can go the to the bottom of scd band to 28000 before rebounding, it’s could be 4000 drop from now levels ,so make sure estimate position size accordingly.
Published this so you can see what to expect and don’t buy big now. Buy very little, or wait for more decline.
Let’s see.
Related publications
Disclaimer
The information and publications are not meant to be, and do not constitute, financial, investment, trading, or other types of advice or recommendations supplied or endorsed by TradingView. Read more in the Terms of Use.
Related publications
Disclaimer
The information and publications are not meant to be, and do not constitute, financial, investment, trading, or other types of advice or recommendations supplied or endorsed by TradingView. Read more in the Terms of Use.