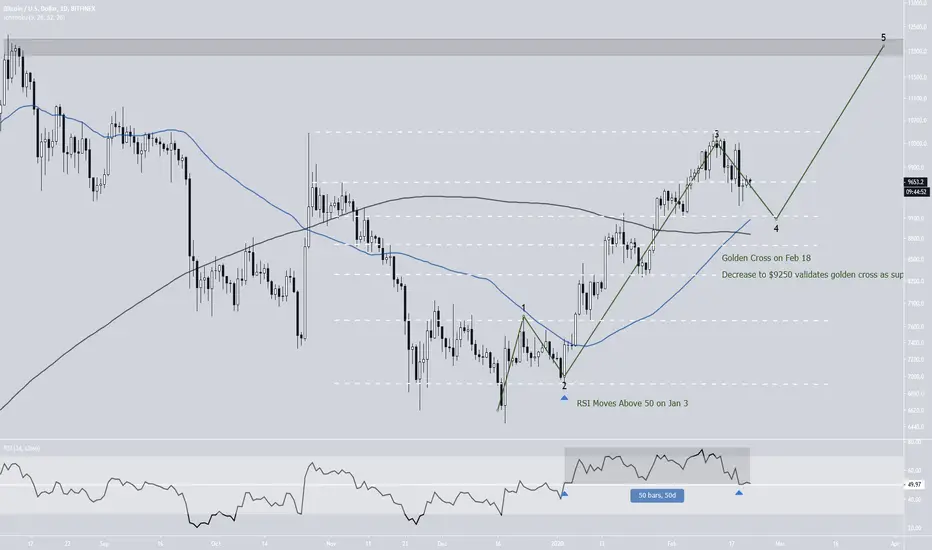
I believe Bitcoin is currently completing the fourth wave of a five wave Elliot formation, with will end near $9150, while the fifth one will end above $12,000.
I have outlined a range, with the main support/resistance areas being at :
The price is currently attempting to flip the $9650 level as support, but it seems more likely that it fails to do so and instead validates it as resistance and $9150 becomes the new support, with the price possibly reaching it next week.
One very important thing to note is the movement of the RSI. The RSI moved above the 50-line (midpoint) on January 3. This is often a sign that the price is in a bullish trend. The RSI has been above this line for 50 days and counting.
The proposed decrease would likely cause the RSI to drop once more. If it bounces, then the projected movement will likely occur, as BTC would begin the fifth wave and move towards the recent high and possibly $12,000.
On the other hand, a RSI movement below 50 would indicate that the price is in a correction.
Another bullish characteristic is the golden cross (50-,200-day) that has transpired. The proposed decrease would also validate the golden cross as support.
I have outlined a range, with the main support/resistance areas being at :
- $10,500
$9650
$9150
$8700
$8250
$7650
$6900
The price is currently attempting to flip the $9650 level as support, but it seems more likely that it fails to do so and instead validates it as resistance and $9150 becomes the new support, with the price possibly reaching it next week.
One very important thing to note is the movement of the RSI. The RSI moved above the 50-line (midpoint) on January 3. This is often a sign that the price is in a bullish trend. The RSI has been above this line for 50 days and counting.
The proposed decrease would likely cause the RSI to drop once more. If it bounces, then the projected movement will likely occur, as BTC would begin the fifth wave and move towards the recent high and possibly $12,000.
On the other hand, a RSI movement below 50 would indicate that the price is in a correction.
Another bullish characteristic is the golden cross (50-,200-day) that has transpired. The proposed decrease would also validate the golden cross as support.
Note
The Bitcoin price has been moving as expected and is in the process of completing the fourth wave. It has almost reached the golden cross in order to validate it as support. In order for the formation to remain valid, the price has to bounce at $9100 at the lowest.
The daily RSI has finally fallen below 50 after 53 days. If the price bounces as expected, the RSI will soon reclaim this level.
The strength of the bounce will determine whether this is the fourth wave and we are heading higher or if we are in for an extended correction.
Whichever may be the case, it will become clearer in the next few days.
Note
Price reached the target, expecting a bounce. Still well within healthy retracement parameters. This is the third time since January that we have had a similar decrease.
Unless we break down strongly at this level, this is just a validation of the previous resistance area as support.
Disclaimer
The information and publications are not meant to be, and do not constitute, financial, investment, trading, or other types of advice or recommendations supplied or endorsed by TradingView. Read more in the Terms of Use.
Disclaimer
The information and publications are not meant to be, and do not constitute, financial, investment, trading, or other types of advice or recommendations supplied or endorsed by TradingView. Read more in the Terms of Use.