Ever since the G20 summit is over, every crypto guy on youtube and every other platform is bragging about the crypto to the moon, BTC to the moon. But looking at the broader picture depicts something else. I want to pull your attention at the bigger time frame. Please don't get me, wrong guys. I'm not spreading the FUD. Just like all of you, I am also a great crypto lover and an all-time BTC believer. So, without wasting time let's get to the point.
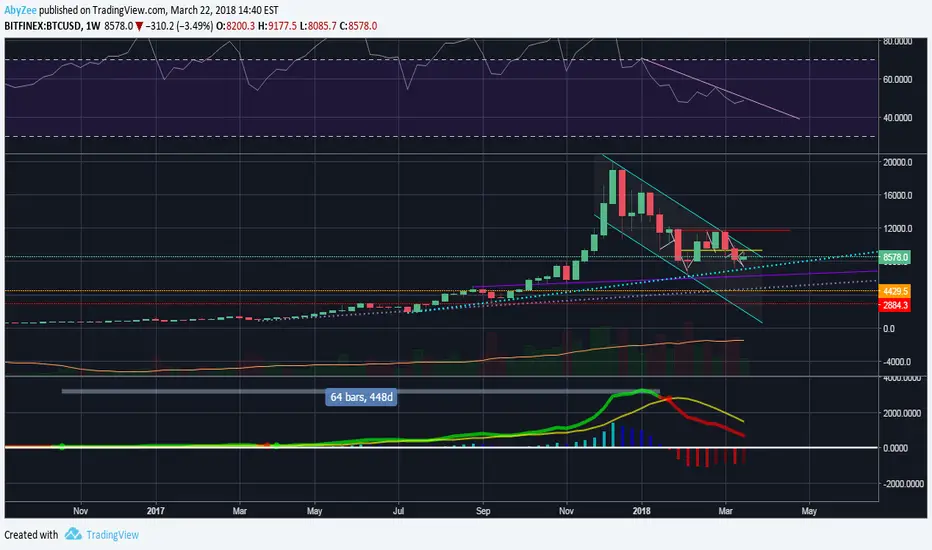
First of all, what I want you to do is set the time frame for weekly and add the RSI and MACD indicators to the chart. Now, check the MACD levels from October 2016. You will notice that the green line hasn't crossed the yellow line from then (2016-10-24) to the January of 2018 (see the time bar mentioned on MACD graph). Bitcoin has been in the uptrend for almost more than a year and that's why we may see a further more major correction in the price of BTC.
Now, bring your cursor on the RSI graph at 53.692 level. You will find support at 2017-07-10, 2017-03-20 and also for the whole month of August 2016. At present, the RSI has constantly fallen from the beginning of this year (weekly timeframe). From the past three months, BTC is following the downtrend channel shown in the chart and is likely to continue to follow it unless we see some reversal in the MACD graph. See the red line below the yellow, that we need to turn in green which would be a super confirmed bullish sign of Bitcoin for a long-term again. These two lines on the MACD graph may take about two to three weeks or maximum four weeks to intersect. By this time we may see the BTC price fallen down to $6000 (approx or maybe even lower).
And now starts the super bull run of BTC which we have been talking for a while "to the moon". Now, a reason to this is, look at the volume. The trading volume is continuously increasing from 2017 and even though now, given the downtrend of BTC, the volume is still increasing. There is no decline in the trading volume since the number of crypto community members are increasing every single day. And that's the main reason Bitcoin can never go to zero. Cause whenever the price goes down, there's more and more buying which ultimately raises the price back on track.
For now, I think, BTC is going to touch $6000 or maybe even low (according to the MACD graph) and then we are gonna go to $30k or even more for sure. Cause, the number of people joining the Bitcoin community is going to increase and ultimately increasing the price. The daily traders who like to ride the waves are already enjoying the rides. And to those who are new and looking for an entry point, I suggest them to wait for one or two weeks, you may get a much better entry at a lower price. And even if you enter at this moment, no worries. Cause though the price goes down, its gonna rise high even stronger.
That's it for now. Thank you for checking out. If you liked my content, please share, like and comment. Eager to know your views, so feel free to comment.
Hope for the best. May the odds be ever in your favor (while trading too).
This information is not a recommendation to buy or sell. It is to be used for educational purposes only.
Disclaimer
The information and publications are not meant to be, and do not constitute, financial, investment, trading, or other types of advice or recommendations supplied or endorsed by TradingView. Read more in the Terms of Use.
Disclaimer
The information and publications are not meant to be, and do not constitute, financial, investment, trading, or other types of advice or recommendations supplied or endorsed by TradingView. Read more in the Terms of Use.