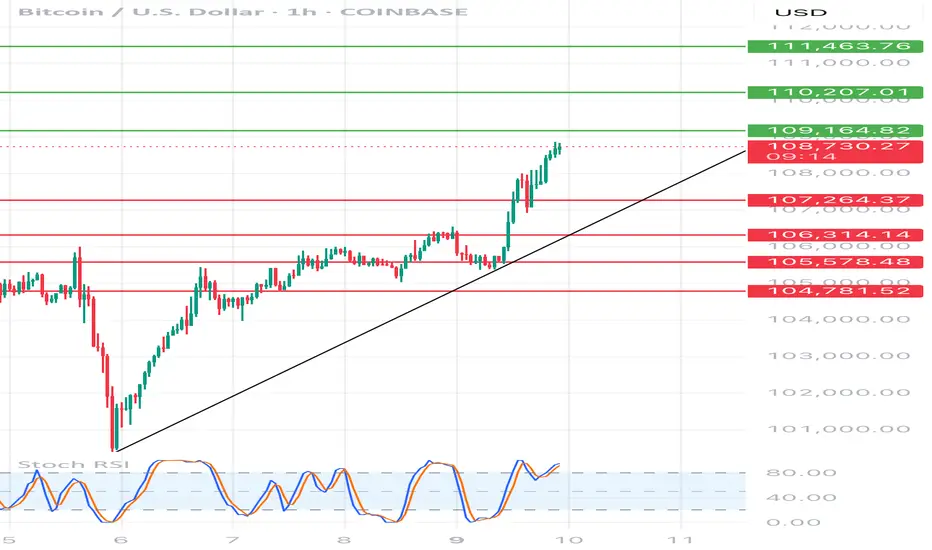
Hello everyone, let's look at the 1H BTC chart for USD, in this situation we can see how the price moves over a strong growth trend line. However, let's start by defining goals for the near future the price must face:
T1 = 109164 $
T2 = 110207 $
Т3 = 111463 $.
Let's go to Stop-Loss now in case of further declines on the market:
SL1 = 107264 $
SL2 = 106314 $
SL3 = 105578 $
SL4 = 104781 $
Looking at the RSI indicator, we see
Return above the upper limit, which can cause an attempt to relax at the coming hours.
T1 = 109164 $
T2 = 110207 $
Т3 = 111463 $.
Let's go to Stop-Loss now in case of further declines on the market:
SL1 = 107264 $
SL2 = 106314 $
SL3 = 105578 $
SL4 = 104781 $
Looking at the RSI indicator, we see
Return above the upper limit, which can cause an attempt to relax at the coming hours.
Disclaimer
The information and publications are not meant to be, and do not constitute, financial, investment, trading, or other types of advice or recommendations supplied or endorsed by TradingView. Read more in the Terms of Use.
Disclaimer
The information and publications are not meant to be, and do not constitute, financial, investment, trading, or other types of advice or recommendations supplied or endorsed by TradingView. Read more in the Terms of Use.