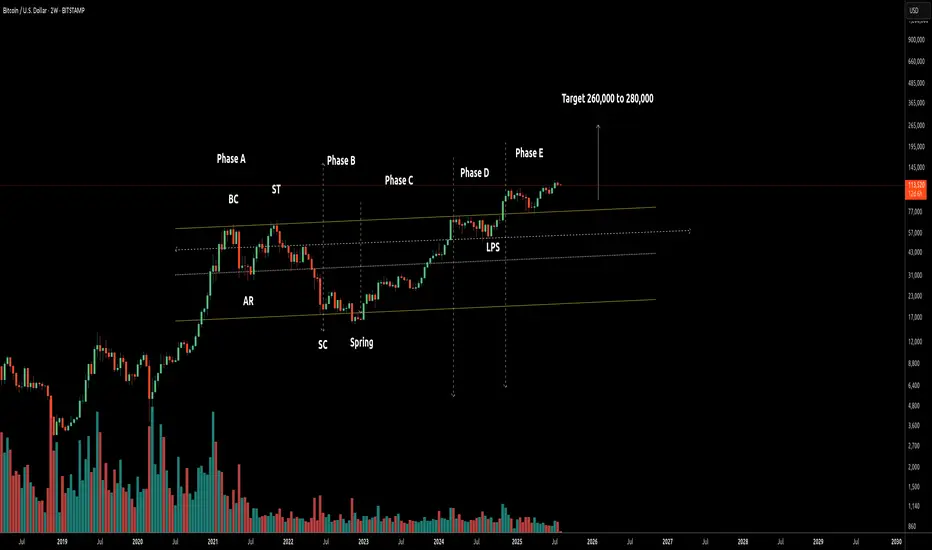
if the wyckoff methodology is applied then this is a re-accumulation phase with a first target in the 150k area followed by a main target in the 260k to 280K zone.
The wyckoff phases identified on the chart are as follows
Phase A:
BC (Buying Climax)
AR (Automatic Reaction)
ST (Secondary Test)
Phase B:
Characterized by volatility and testing within the range.
Phase C:
SC (Selling Climax)
Spring – a final shakeout below support to mislead traders before upward movement.
Phase D:
Clear higher highs and higher lows; sign of strength (SOS) and last point of support (LPS) observed.
Phase E :
Price has broken above the re-accumulation range and rested the trading range which is now acting as support.
As the assets price exits the trading range id expect a strong move to around the 150K area followed by a secondary move to the 260-280k target.
Trade active
if the wyckoff Point and Figure (PnF) analysis is applied we can use it to calculate the first target stop after a breakout. Using the PnF method the first target should be between 133k and 180k and this will also be the take profit area.
P&F Count Estimation using the following: structure:
==============================================
a) Major low (Spring/Phase C): Around $15,500-16,000
b) Potential breakout level: Around $73,000-75,000 (previous highs)
c) Current resistance to clear: Around $70,000-75,000 range
d)From the width of the accumulation pattern there are 12-15 columns of consolidation activity.
Conservative P&F Target
--------------------------------------------
using the vertical count method:
Base = ~$60,000 range width
Breakout point = ~$73,000
Conservative target = $73,000 + $60,000 = ~$133,000
Aggressive P&F Target:
--------------------------------------
Using a wider count or horizontal count method:
Extended range = ~$90,000-100,000
Breakout point = ~$73,000
Aggressive target = $73,000 + $100,000 = ~$173,000-180,000
Disclaimer
The information and publications are not meant to be, and do not constitute, financial, investment, trading, or other types of advice or recommendations supplied or endorsed by TradingView. Read more in the Terms of Use.
Disclaimer
The information and publications are not meant to be, and do not constitute, financial, investment, trading, or other types of advice or recommendations supplied or endorsed by TradingView. Read more in the Terms of Use.