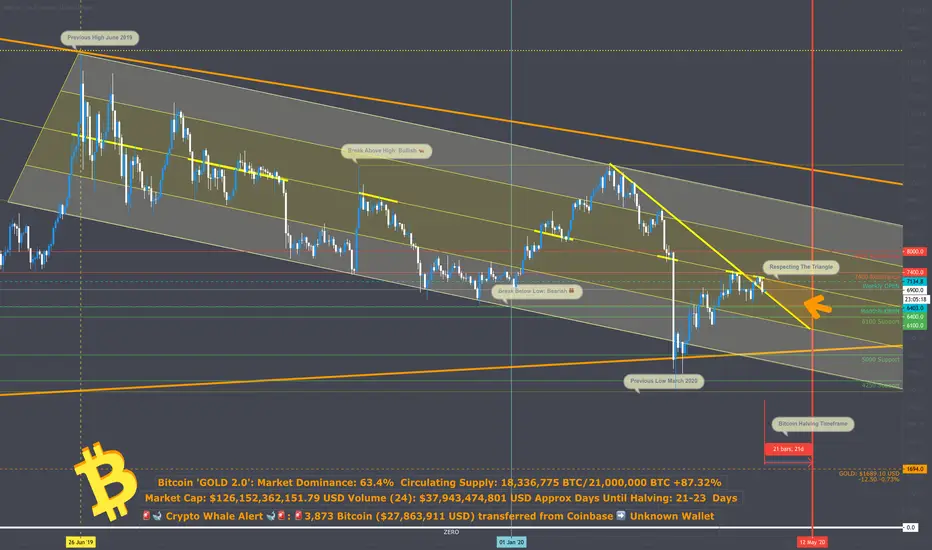
Bitcoin ‘GOLD 2.0’ Overview: Yesterday we wrote ‘Indicated on the chart is an orange triangle where if price doesn't break the midpoint this will be the trading range and thus will consume price for the following days if not weeks if price is to progressively fall.’ As we can see price tested the 7200 region yet couldn’t penetrate and break although buyers did push considerably. Within a few hours we saw price drop to the bottom of the trend line with selling pressure as this acted as an area of support with todays daily candle opening at 6900 region
Biggest Bitcoin Transaction of the Day
🚨 3,873 Bitcoin ($27,863,911 USD) transferred from Coinbase ➡️ Unknown Wallet
Support Levels: 6400 is Support
Resistance Levels: Next major horizontal resistance is 7400/ Also mid point of the downward channel
Point of Interest: Watching price within the triangle depicted on the chart
🐃Bulls Verse Bears 🐻
Bullish above 10500
Bearish below 6500
Bitcoin to Date:
Overall
Approximate Bitcoin Dominance: 63.4%
Approximate Bitcoin in Circulation: 18,336,775 BTC
Approximate Bitcoin Left to Mine: 2,663,225 BTC
Road to 21,000,000 Bitcoin Mined: 87.32%
Approximate Days Until Halving: 21-23 Days
Daily
Current Price: $6909 USD
Daily Change %:-1.05%
Market Cap: $126,152,362,151.79 USD
24 Hour Volume: $37,943,474,801 USD
Population of the World: ~7,779,162,480+ humans
Bitcoin/World Population: ~ 0.002357165703524 Satoshi’s / $16.28 per person
“Every Professional Trader knows that you have to absolutely have a personal life that’s simple and a trading life that mirrors your personal life and vice versa.”
GOLD: $1689.10 USD -12.50 -0.73% Gold has fallen $12 USD within the day.
Related publications
Disclaimer
The information and publications are not meant to be, and do not constitute, financial, investment, trading, or other types of advice or recommendations supplied or endorsed by TradingView. Read more in the Terms of Use.
Related publications
Disclaimer
The information and publications are not meant to be, and do not constitute, financial, investment, trading, or other types of advice or recommendations supplied or endorsed by TradingView. Read more in the Terms of Use.