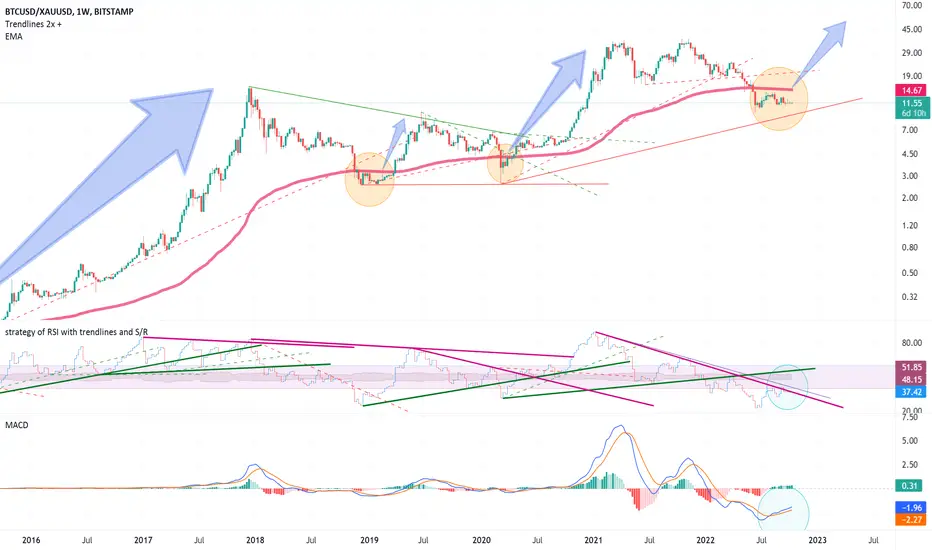
Long term signals usually prove that they have a good value. In this chart we can see that Bitcoin has made a
- Crossover at MACD,
- Close to crossover at RSI trend
and
- Below 200 EMA
Which makes me think that this is a valuable entry point.
Dont forget this is a weekly chart and needs time to work.
Please DYOR.
- Crossover at MACD,
- Close to crossover at RSI trend
and
- Below 200 EMA
Which makes me think that this is a valuable entry point.
Dont forget this is a weekly chart and needs time to work.
Please DYOR.
Note
Trend line hit.I use Wundertrading to automate my strategies: wundertrading.com/en/trader/register?ref=wbtd9f5727c
Disclaimer
The information and publications are not meant to be, and do not constitute, financial, investment, trading, or other types of advice or recommendations supplied or endorsed by TradingView. Read more in the Terms of Use.
I use Wundertrading to automate my strategies: wundertrading.com/en/trader/register?ref=wbtd9f5727c
Disclaimer
The information and publications are not meant to be, and do not constitute, financial, investment, trading, or other types of advice or recommendations supplied or endorsed by TradingView. Read more in the Terms of Use.