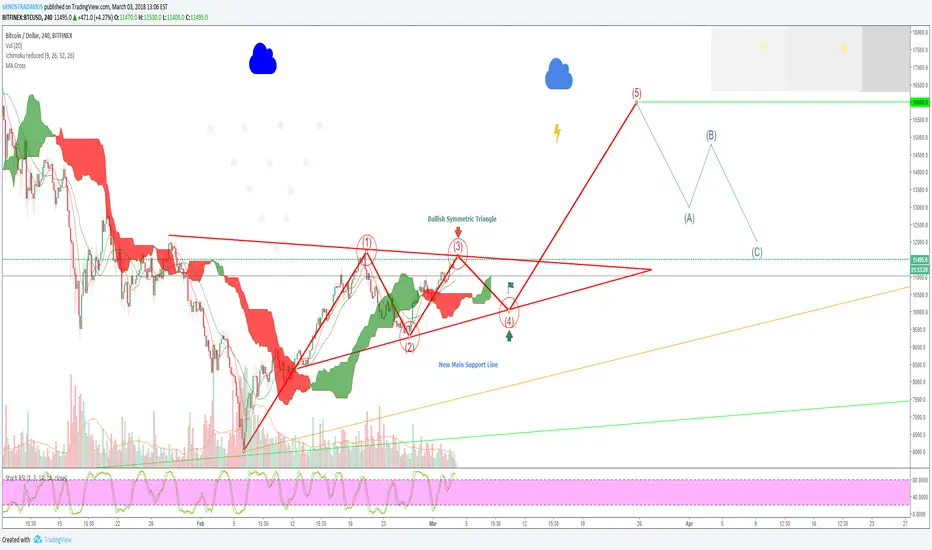
We are in wave 3 and now we are heading towards point 4
The symmetrical triangle pattern is easy to spot thanks to the distinctive shape which is developed by the two trendlines which converge. This pattern occurs by drawing trendlines, which connect a series of peaks and troughs. The trendlines create a barrier, and once the price breaks through these, a very sharp movement in price follows.
Buy : 10.000 10.250
Target : 16.000
Stop Loss : 9900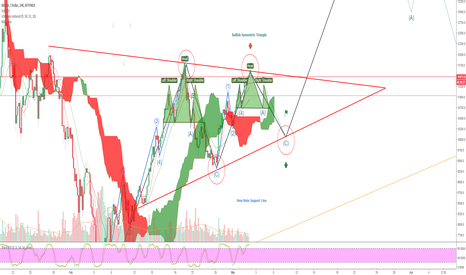
Note
Note your friendsThis chart is a Bullish Symmetric Triangle !!!
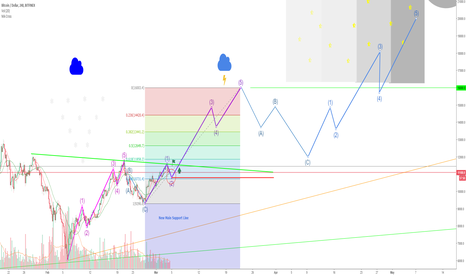
Only the Elliot Wave Instrument is used
Do not confuse them
Note
Note
Go Down To 11230Note
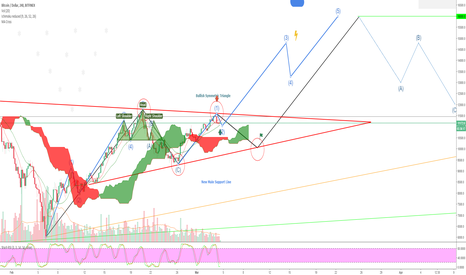
Go Up 11600Note
You see that it is perfectly consistent with our chartNote
Between 8 and 12 hours, we'll be priced at 11600 and the big downside will beginNote
This prediction will definitely happenEasily trade with friends
I guarantee
Note
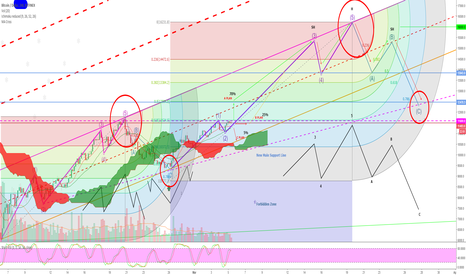
The last chance for head formationWe will go from 11400 to 11600
And ...
After that we will have a very heavy sale and downgrade
Note
Dear friends, please click on the AGREES when you see this chart and you see that our exact prediction is correctThanks
Note
We are emptying the RSICertainly we will reach the summit
Note
This text is specially for Persian language :Doustane azizam salam
ma dar hale hazer az in ragham payin tar nakhahim raft
ghatan be 11550 ela 11600 khahim resid
...
lotfan follow agreed konid
mitounid soalatetoun o az tarighe comment fingilish post konid man pasokhgou hastam
montazere commentatoun zire in post hastam
bebinam chand nafar irani inja darim
;-)
movafagh bashid
Note
Being deployed and ready to jump to 11600Note
Note
This is the last line of support!Note
HODL And Get a profit 11600 Price
Note
Do not worryWe are emptying the RSI
Note
11260 SupportTarget 11600
Note
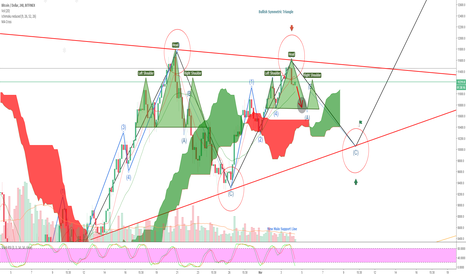
The whole head could not formBlood bath is on the way!
Note
You see that our chart is happeningBe sure to be updated soon
Follow this chart and suggest your friends
Note
We'll be back on the shoulders soonTake caution!!!
Note
We will go down to a figure of about 10,600 to 10,800 with shouldersNote
Tip : If you do not have the intention of trading, do not fear fear
We'll go a little bit
Do not be afraid and not worried
My short-time friends do the same
LONG : 100% HODL
SHORT : Trade Is Open !
Good luck
Note
Note
You see that we're going downI think the 10800 line supports us
Note
Do not be afraidit is nothing
10800 will definitely support us
Note
Note
It's possible that we are in the second waveSo be careful
Note
Nothing is clear yetThe exact signal is not received
Must wait
Note
If-11600-break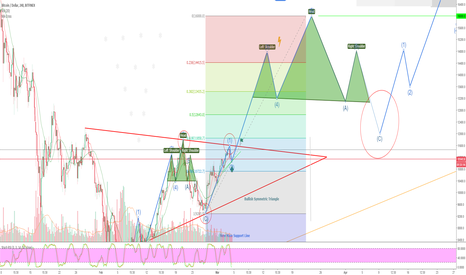
Note
10800 or 11600 4000 or 16000
The problem is!!!
Note
Note
Do not be so happy or very upset because Bitcoin is alive!Note
Return to the correct location of the rocket launcherNote
Preparing for a throwNote
Note
Triple Bottoms are reversal patterns!Note
We flaggedYes that's right
We are upgrading to the third wave of awards
Note
The market is very saturatedRSI is approaching its highest limit at Framesday
This means we will soon find a place to rest
But where ???
Note
11400 can be a good placeNote
Order cancelled
Disclaimer
The information and publications are not meant to be, and do not constitute, financial, investment, trading, or other types of advice or recommendations supplied or endorsed by TradingView. Read more in the Terms of Use.
Disclaimer
The information and publications are not meant to be, and do not constitute, financial, investment, trading, or other types of advice or recommendations supplied or endorsed by TradingView. Read more in the Terms of Use.