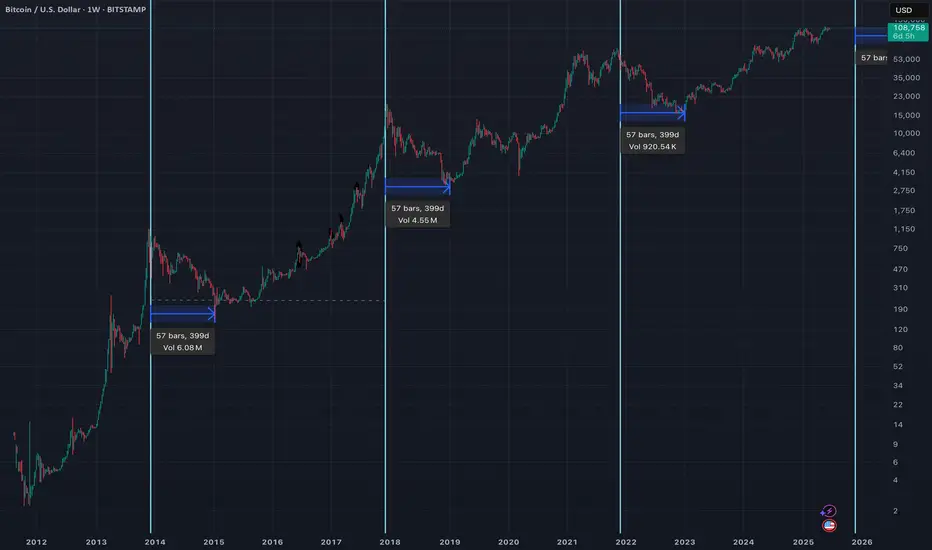
People say this cycle is different. But so far, when you zoom out, things are following the general trends.
- The white vertical lines represents exactly 4 years from the first cycle peak
- The blue measurements represents exactly 399 days after the white vertical lines
The trend (so far) is clear. Bitcoin has a cycle peak every 4 years, and has a cycle bottom 399 days later
If this trend was to follow this cycle:
1. Bitcoin to peak on the week of 24th November 2025
2. Bitcoin to bottom on the week of 28th December 2026
Let me know what you think!
Trade active
If you found this useful, please check out my YouTube channel on:youtube.com/@theinvestingacademy
Disclaimer
The information and publications are not meant to be, and do not constitute, financial, investment, trading, or other types of advice or recommendations supplied or endorsed by TradingView. Read more in the Terms of Use.
Disclaimer
The information and publications are not meant to be, and do not constitute, financial, investment, trading, or other types of advice or recommendations supplied or endorsed by TradingView. Read more in the Terms of Use.