Hello traders,
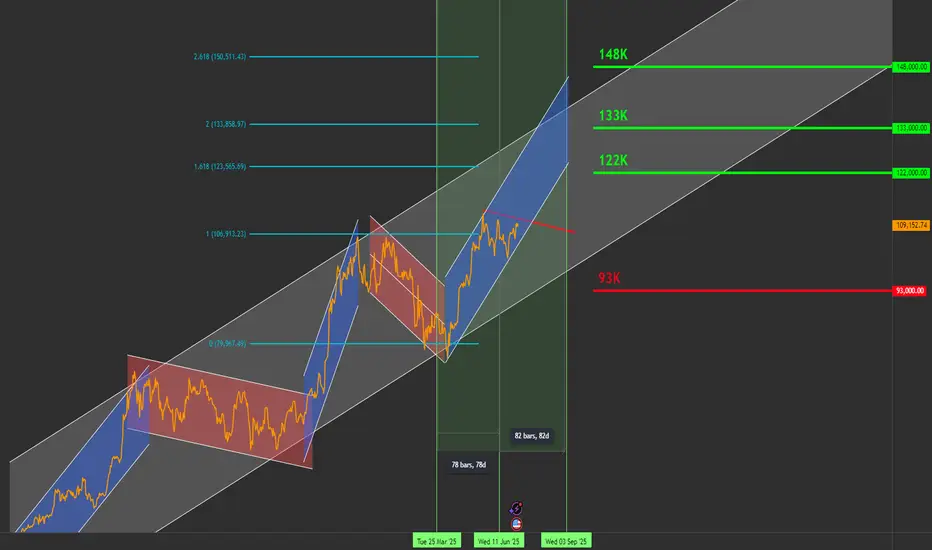
I'm sharing my current outlook on Bitcoin using the daily timeframe. Price is ~109K below a key descending trendline (in red), which has defined the structure since 21 May.
🔍 Key Levels to Watch:
Resistance: $111,000
Support: $91,000
Current Price: ~$109,000
⚡ Breakout Scenario:
If Bitcoin closes above $111K on the daily chart, backed by strong volume (ideally 30% above the 20-day average), I expect the next targets to unfold as:
✅ $122,000
✅ $133,000
✅ $144,000
🗓️ Target date for $144K: Around 22 September 2025
This projection is based on a pivot structure I’m tracking:
🟢 25 March 2025: Pivot low at ~$84K
🔴 12 June 2025: Pivot high
🟡 Expected pivot high: ~4 September 2025 (if symmetry holds)
This pattern suggests a 1-2-3 formation that could lead to a breakout move.
🧯 Failure Scenario:
If BTC fails to break out, I’m watching for a pullback toward the $91K support zone.
🛑 Current Stance:
I’m not in a position yet. Waiting for a daily candle close above $111K with volume confirmation and momentum indicators.
📣 Stay Updated
I’ll be sharing daily updates as the price action evolves.
Follow me here on TradingView, and feel free to share your analysis or ask questions in the comments!
🏷️ Hashtags:
#BTCUSD #BitcoinAnalysis #CryptoTrading #BTC #TechnicalAnalysis #SwingTrade #BreakoutSetup
Let me know your comments.
Trade active
still waiting for confirmationTrade closed: target reached
first target acheived 122K, rise stop-loss to entry price to secure profitDisclaimer
The information and publications are not meant to be, and do not constitute, financial, investment, trading, or other types of advice or recommendations supplied or endorsed by TradingView. Read more in the Terms of Use.
Disclaimer
The information and publications are not meant to be, and do not constitute, financial, investment, trading, or other types of advice or recommendations supplied or endorsed by TradingView. Read more in the Terms of Use.