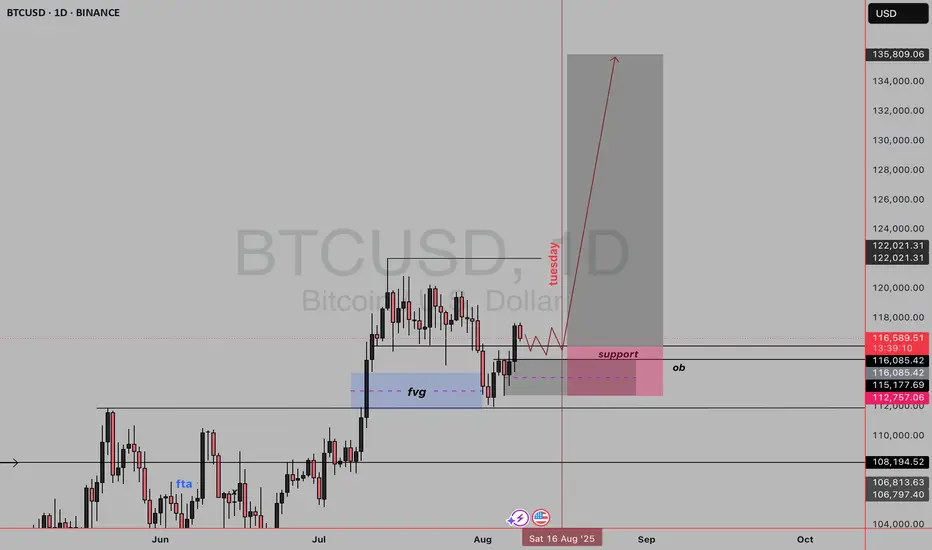
Your BTC/USD daily chart shows a Smart Money Concept (SMC) bullish setup with the following key points:
1. Market Structure
Price had a recent drop but is now retracing back upward.
The chart suggests accumulation and preparation for a bullish push.
There's a clear swing high liquidity above previous highs that price may target.
2. Key Zones
OB (Order Block) in pink:
This is the last bullish candle before a strong move down.
Price is expected to react here — either as a support retest before going higher.
Support (labelled in pink):
Aligned with the OB, acting as a confluence zone for buyers.
FVG (Fair Value Gap) in blue:
This gap represents inefficiency in price.
Price has tapped into it and could use it as a base to move higher.
3. Price Expectation
The red path suggests:
Small consolidation near the support/OB zone until around Tuesday (timing element in your plan).
Then, strong bullish expansion targeting above $122K, and potentially into the $135K range.
4. Liquidity
Liquidity sits above recent highs (marked near $122,021).
Market makers may push price up to take that liquidity before any reversal.
5. Trade Logic
Entry: On retest of the OB/support zone (around $116,000–$115,000).
Stop Loss: Below the OB or the $112,757 level.
Targets:
Short-term: $122,021 (liquidity grab).
Long-term: $135,809.
Disclaimer
The information and publications are not meant to be, and do not constitute, financial, investment, trading, or other types of advice or recommendations supplied or endorsed by TradingView. Read more in the Terms of Use.
Disclaimer
The information and publications are not meant to be, and do not constitute, financial, investment, trading, or other types of advice or recommendations supplied or endorsed by TradingView. Read more in the Terms of Use.