Chart Overview
⚙️ Price Action:
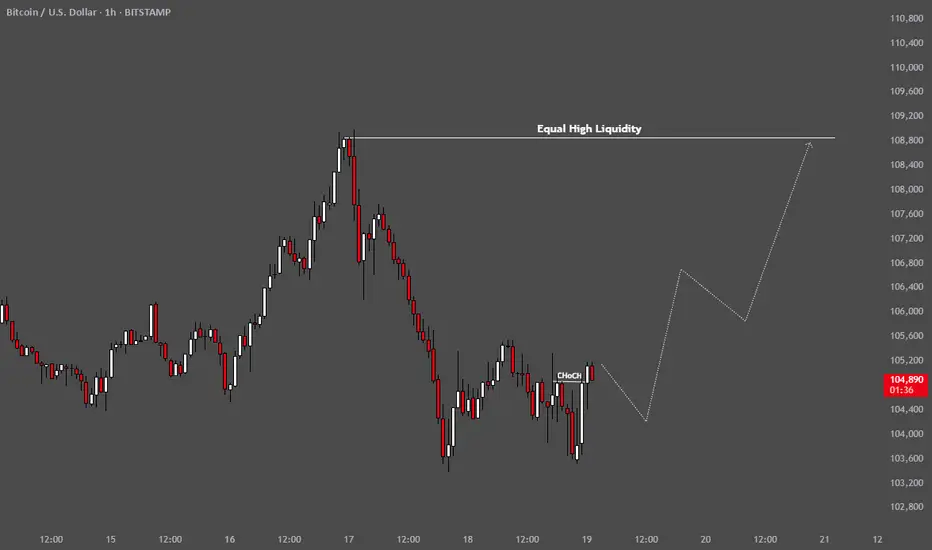
The chart illustrates a recent downtrend, followed by consolidation near the current level of $104,933.
A bullish reversal structure is forming, marked by the label “Ch0CH” (Change of Character), which suggests a potential trend shift from bearish to bullish.
🧠
Liquidity Concept
:
The chart highlights a horizontal line labeled “Equal High Liquidity” around the $108,800 level.
This area suggests a liquidity pool where stop orders might be resting above the equal highs.
Market makers may drive price toward this area to collect liquidity before reversing or continuing.
📈
Projected Price Path
:
A white dotted line projects a possible bullish move:
First, a minor retracement or accumulation phase.
Then, an upward impulse aiming to take out the equal highs near $108,800.
🧩 Interpretation:
This chart implies a bullish outlook based on:
Break in bearish structure (Ch0CH).
Liquidity draw above equal highs.
Anticipation of smart money concepts (e.g., liquidity sweeps, inducement moves).
⚙️ Price Action:
The chart illustrates a recent downtrend, followed by consolidation near the current level of $104,933.
A bullish reversal structure is forming, marked by the label “Ch0CH” (Change of Character), which suggests a potential trend shift from bearish to bullish.
🧠
Liquidity Concept
:
The chart highlights a horizontal line labeled “Equal High Liquidity” around the $108,800 level.
This area suggests a liquidity pool where stop orders might be resting above the equal highs.
Market makers may drive price toward this area to collect liquidity before reversing or continuing.
📈
Projected Price Path
:
A white dotted line projects a possible bullish move:
First, a minor retracement or accumulation phase.
Then, an upward impulse aiming to take out the equal highs near $108,800.
🧩 Interpretation:
This chart implies a bullish outlook based on:
Break in bearish structure (Ch0CH).
Liquidity draw above equal highs.
Anticipation of smart money concepts (e.g., liquidity sweeps, inducement moves).
💰 King Maker FX — Master the Gold Market with Precision.
Unlock real-time trends, pro strategies, and expert insights to turn every move into profit. 🚀✨ t.me/kmforexllc
Unlock real-time trends, pro strategies, and expert insights to turn every move into profit. 🚀✨ t.me/kmforexllc
Disclaimer
The information and publications are not meant to be, and do not constitute, financial, investment, trading, or other types of advice or recommendations supplied or endorsed by TradingView. Read more in the Terms of Use.