Full Disclosure: I have been drinking and am well above the legal limit.
Previous analysis/position: Expecting long squeeze to push us down to $7,250 due to long:short ratio with a 30% chance of a rally due to C Clamps on the 1h and 2h Ichimoku Clouds.
Patterns: 1h fits into a Wyckoff Distribution with a throwback, could be getting ready for Re-Distribution. Possible h&s forming if we continue to range between $7,300 - $7,500
Horizontal support and resistance: R: $7,528 S: $7,324
BTCUSDSHORTS: Continues to form lower highs and lower lows. Surprised that shorts still are not starting to pick up. 62%:38% long:short ratio.
Funding Rates: Longs pay shorts 0.01%
12 & 26 EMA’s (calculate % difference): 12 = -3.39% and angling down sharply | 26 = -0.77%
50 & 128 MA’s: 50 = + 7.04% and angling upward sharply | 128 = -2.29%
FIB’s: 0.236 = $5,920 | 0.382 = $8,496 | 0.5 = $10,677
Candlestick analysis: 12h inverted hammer on top of the 50 MA after a golden cross.
Ichimoku Cloud: Still inside the daily cloud. Support from Kijun-Sen (Tenken-Sen angling downward sharply)
TD’ Sequential: R-5 < R-4 after topping on an R-9. 2nd candle correction after an R-9 on the 12h.
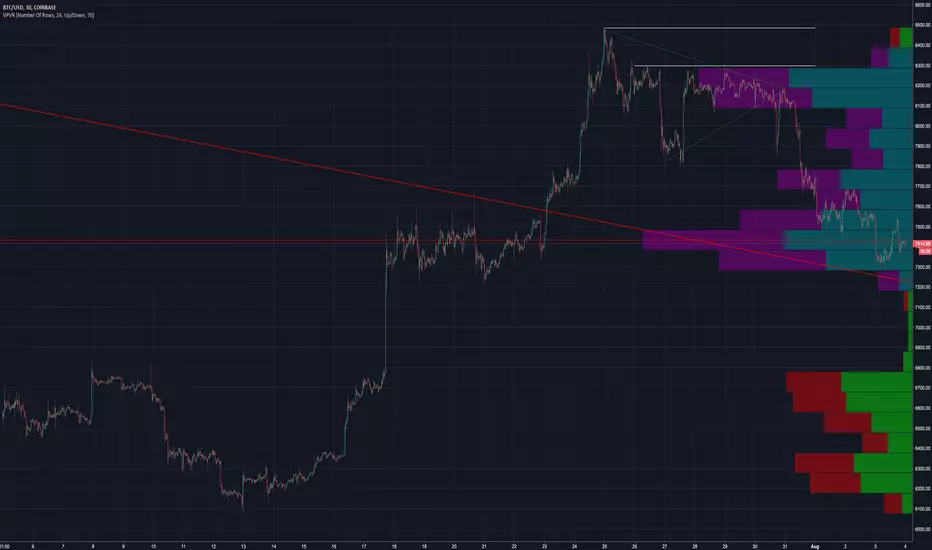
Visible Range: 24 hour point of control = $7,385 | 5d POC = $7,537 | 1m POC = $7,433 *** | 1y POC = $8,161
BTC’ Price Spreadsheet: 12h = -0.81% | 24h = -1.57% | 1w = -9.09% | 2w = +1.29% | 1m = +14.01%
Bollinger Bands: Below MA on daily and weekly, still above on 3d.
Trendline: Retesting trendline that connects March 5th and May 5th.
Daily Trend: Bearish
Fractals: DOWN = $7,202 | UP = $8,281
On Balance Volume: Trending down with price
ADX: +DI just crossed under -DI with the ADX > 25, indicating a reversal in trend
Chaikin Money Flow: Failed to turn 0.15 into support, now trending down w price
RSI (30 setting): Still > 50 on daily and weekly
Stoch: Re entering oversold zones on daily.
Summary: We are now trading below the point of control when looking back 1 month. That means the majority of the volume, or resistance, is above us. If we do get a bounce above that level then I expect it to be brief. A head and shoulders forming on the daily would make a lot of sense. That would give us the chance to cool off from being oversold and it would also allow the bears to eat away at support. I don’t like being a bear (long term hodler) but I will continue to be as long as we are in a bear market. Would say there is a 15% chance we get a bounce to $7,800 - $8,000 and if we do it would provide a great selling opportunity.
Thanks for reading!
Previous analysis/position: Expecting long squeeze to push us down to $7,250 due to long:short ratio with a 30% chance of a rally due to C Clamps on the 1h and 2h Ichimoku Clouds.
Patterns: 1h fits into a Wyckoff Distribution with a throwback, could be getting ready for Re-Distribution. Possible h&s forming if we continue to range between $7,300 - $7,500
Horizontal support and resistance: R: $7,528 S: $7,324
BTCUSDSHORTS: Continues to form lower highs and lower lows. Surprised that shorts still are not starting to pick up. 62%:38% long:short ratio.
Funding Rates: Longs pay shorts 0.01%
12 & 26 EMA’s (calculate % difference): 12 = -3.39% and angling down sharply | 26 = -0.77%
50 & 128 MA’s: 50 = + 7.04% and angling upward sharply | 128 = -2.29%
FIB’s: 0.236 = $5,920 | 0.382 = $8,496 | 0.5 = $10,677
Candlestick analysis: 12h inverted hammer on top of the 50 MA after a golden cross.
Ichimoku Cloud: Still inside the daily cloud. Support from Kijun-Sen (Tenken-Sen angling downward sharply)
TD’ Sequential: R-5 < R-4 after topping on an R-9. 2nd candle correction after an R-9 on the 12h.
Visible Range: 24 hour point of control = $7,385 | 5d POC = $7,537 | 1m POC = $7,433 *** | 1y POC = $8,161
BTC’ Price Spreadsheet: 12h = -0.81% | 24h = -1.57% | 1w = -9.09% | 2w = +1.29% | 1m = +14.01%
Bollinger Bands: Below MA on daily and weekly, still above on 3d.
Trendline: Retesting trendline that connects March 5th and May 5th.
Daily Trend: Bearish
Fractals: DOWN = $7,202 | UP = $8,281
On Balance Volume: Trending down with price
ADX: +DI just crossed under -DI with the ADX > 25, indicating a reversal in trend
Chaikin Money Flow: Failed to turn 0.15 into support, now trending down w price
RSI (30 setting): Still > 50 on daily and weekly
Stoch: Re entering oversold zones on daily.
Summary: We are now trading below the point of control when looking back 1 month. That means the majority of the volume, or resistance, is above us. If we do get a bounce above that level then I expect it to be brief. A head and shoulders forming on the daily would make a lot of sense. That would give us the chance to cool off from being oversold and it would also allow the bears to eat away at support. I don’t like being a bear (long term hodler) but I will continue to be as long as we are in a bear market. Would say there is a 15% chance we get a bounce to $7,800 - $8,000 and if we do it would provide a great selling opportunity.
Thanks for reading!
emasar Indicator is available for purchase at alphanalysis.io/product/emasar/
Disclaimer
The information and publications are not meant to be, and do not constitute, financial, investment, trading, or other types of advice or recommendations supplied or endorsed by TradingView. Read more in the Terms of Use.