Bitcoin is stuck in a range. On the one hand it could collapse lower, especially if stocks crash, but on the other hand it is still holding very well and there is hope. Here I’d like to explain a bullish fractal I am looking at and the market keeps behaving in a certain way.
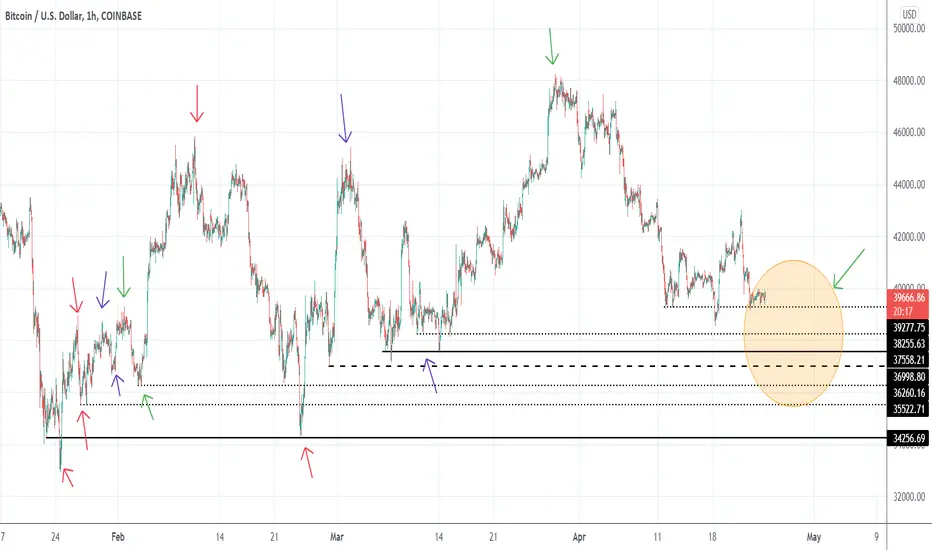
The fractal is pretty simple and occurred at the bottom. In my opinion the market as a whole could be ready to repeat that move on a much larger scale. First, we had a capitulation low with an SFP. The market then bounced and topped. However, on the way down, it formed a higher low. Then it bounced and essentially created an equal high. Then dipped again and formed yet another higher low. Then broke the highs, fell back below them, broke the latest higher low, and then exploded higher. By looking at the colored arrows you can see that the market is forming the same fractal at a much larger scale and what is required is that it dips in the 35500-37000 area. For the fractal to be completed, the market needs to raid the low from which the last move up originated.
Essentially the last sentence in the paragraph above, is the pattern that has kept repeating over and over since January. The market forms a low, the breaks the low and quickly reverses to the upside. Then retests the first low (the first level that was broken) and it turns it back into support. What that means is that the initial support was broken in order to trap shorts, and the retest of it was validation that it was still strong support. In the chart above I have put solid lines as support levels that were broken, but weren’t double/triple bottoms. The dotted lines are support levels that were double bottoms, which the market would have wanted to break, and the dashed lines are the double bottoms that haven’t been broken yet.
Therefore, by the way things are looking like right now, the dashed line is about to break and the bottom will come in one of the dotted lines at 36300 or 35500. Now it isn’t clear whether that will be the absolute bottom or not, or whether the fractal will repeat, however that area is a really important one and definitely worth buying even if it is for a bounce only.
Disclaimer
The information and publications are not meant to be, and do not constitute, financial, investment, trading, or other types of advice or recommendations supplied or endorsed by TradingView. Read more in the Terms of Use.
Disclaimer
The information and publications are not meant to be, and do not constitute, financial, investment, trading, or other types of advice or recommendations supplied or endorsed by TradingView. Read more in the Terms of Use.