"WHAT A MASSIVE BULLISH CANDLE! LET'S GO LONG"
Well, not yet.
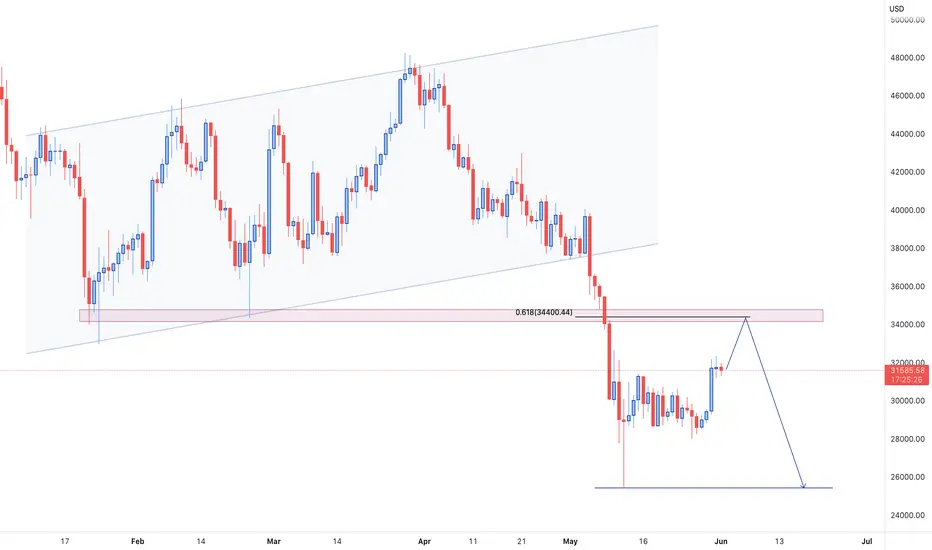
After breaking out of the ascending channel that is illustrated on the chart, the price started dropping massively and reaching new Lower Low marks. Zooming into lower timeframe charts, it can be inferred that the price has been trading within the borders of a freshly formed range for a while. Recently, a nice bullish candle has been able to pierce through the upper boundary of the rectangular box. This alone makes the bulls believe that the bearish reign is over and the bullish control is gonna take over soon.
However, technically speaking, there is no need to rush yet, as there is clearly more room for the price to drop to the downside. We are closely monitoring the price action and patiently waiting for the price to re-test the zone of resistance plotted on the graph that perfectly lines up with the 0.618 Fibonacci retracement level. After that, we will look for confirmations around that area before going short and aiming for the $25.5k zone of support shown on the chart.
Well, not yet.
After breaking out of the ascending channel that is illustrated on the chart, the price started dropping massively and reaching new Lower Low marks. Zooming into lower timeframe charts, it can be inferred that the price has been trading within the borders of a freshly formed range for a while. Recently, a nice bullish candle has been able to pierce through the upper boundary of the rectangular box. This alone makes the bulls believe that the bearish reign is over and the bullish control is gonna take over soon.
However, technically speaking, there is no need to rush yet, as there is clearly more room for the price to drop to the downside. We are closely monitoring the price action and patiently waiting for the price to re-test the zone of resistance plotted on the graph that perfectly lines up with the 0.618 Fibonacci retracement level. After that, we will look for confirmations around that area before going short and aiming for the $25.5k zone of support shown on the chart.
Disclaimer
The information and publications are not meant to be, and do not constitute, financial, investment, trading, or other types of advice or recommendations supplied or endorsed by TradingView. Read more in the Terms of Use.
Disclaimer
The information and publications are not meant to be, and do not constitute, financial, investment, trading, or other types of advice or recommendations supplied or endorsed by TradingView. Read more in the Terms of Use.