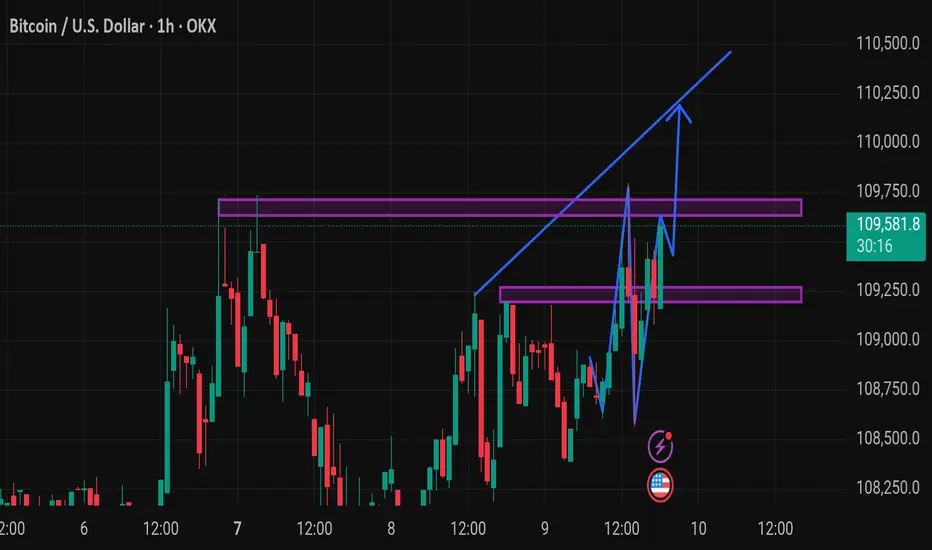
This BTC/USD 1-hour chart suggests a bullish breakout scenario. Here's a breakdown of key technical signals:
Key Observations:
1. Price Level: Current price is $109,582.1, with a recent rise of +0.59%.
2. Resistance Zones (Purple Boxes):
First resistance near $109,800 – $109,900.
Second (minor) resistance around $109,300 – $109,400.
Price is testing the upper resistance zone now.
3. Bullish W Pattern:
A sharp drop and recovery formed a “W” pattern—common before breakouts.
The neckline of this W is being challenged.
4. Trendline Breakout Projection (Blue Arrows):
The chart suggests a breakout projection towards $110,300 – $110,400.
This is based on the upward trajectory from the recent swing low.
5. Support Zone (Lower Purple Box):
Support established at $109,150 – $109,250.
If price
🎯XAUUSD GOLD Daily 8-9 Free Signals🚀 World Best community Join Here ✅
💫XAUUSD
💫BTC
💫EURUSD
For Signals Telegram channel
⬇️⬇️⬇️⬇️⬇️⬇️⬇️⬇️⬇️⬇️⬇️⬇️⬇️
t.me/technicaltrader10
💫XAUUSD
💫BTC
💫EURUSD
For Signals Telegram channel
⬇️⬇️⬇️⬇️⬇️⬇️⬇️⬇️⬇️⬇️⬇️⬇️⬇️
t.me/technicaltrader10
Disclaimer
The information and publications are not meant to be, and do not constitute, financial, investment, trading, or other types of advice or recommendations supplied or endorsed by TradingView. Read more in the Terms of Use.