Disruptive Bearish Scenarios:
1. Support Area Breakdown
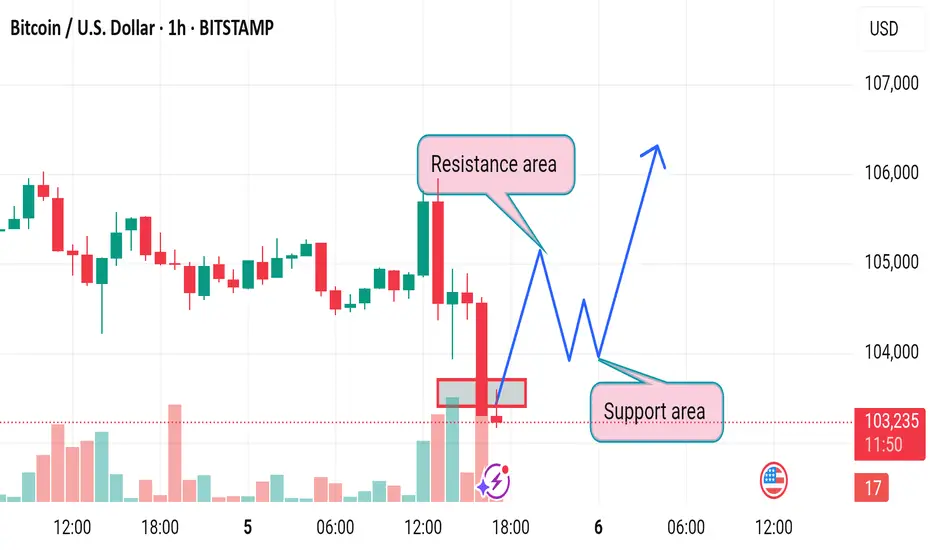
The recent strong bearish candle with high volume shows aggressive selling pressure.
If the price fails to hold above the support area and closes below it, especially on high volume, it could invalidate the bullish recovery.
> Bearish Alternative: Price breaks below 103,000, retests it as resistance (bearish flip), and continues down toward 101,000–100,000.
---
2. Lower High Trap
The projected bounce could form a lower high below the 106,000 resistance, creating a classic bearish structure.
> Disruption Path: After a minor recovery toward 104,500–105,000, sellers regain control, and BTC resumes the downtrend.
---
3. Fake Support Bounce
The support area could create a fake-out bounce, tricking long traders before a sharper reversal.
The move up may lack follow-through due to diminishing bullish volume.
1. Support Area Breakdown
The recent strong bearish candle with high volume shows aggressive selling pressure.
If the price fails to hold above the support area and closes below it, especially on high volume, it could invalidate the bullish recovery.
> Bearish Alternative: Price breaks below 103,000, retests it as resistance (bearish flip), and continues down toward 101,000–100,000.
---
2. Lower High Trap
The projected bounce could form a lower high below the 106,000 resistance, creating a classic bearish structure.
> Disruption Path: After a minor recovery toward 104,500–105,000, sellers regain control, and BTC resumes the downtrend.
---
3. Fake Support Bounce
The support area could create a fake-out bounce, tricking long traders before a sharper reversal.
The move up may lack follow-through due to diminishing bullish volume.
t.me/gold_free_signals1
𝙁𝙤𝙧𝙚𝙭 𝙩𝙧𝙖𝙙𝙞𝙣𝙜 𝙚𝙭𝙥𝙚𝙧𝙞𝙚𝙣𝙘𝙚 𝙩𝙚𝙖𝙢 ☺️ 𝙢𝙖𝙣𝙖𝙜𝙚 𝙮𝙤𝙪𝙧 𝙖𝙘𝙘𝙤𝙪𝙣𝙩 𝙢𝙖𝙠𝙞𝙣𝙜 𝙢𝙤𝙣𝙚𝙮 🤑💰
t.me/gold_free_signals1
𝙁𝙤𝙧𝙚𝙭 𝙩𝙧𝙖𝙙𝙞𝙣𝙜 𝙚𝙭𝙥𝙚𝙧𝙞𝙚𝙣𝙘𝙚 𝙩𝙚𝙖𝙢 ☺️ 𝙢𝙖𝙣𝙖𝙜𝙚 𝙮𝙤𝙪𝙧 𝙖𝙘𝙘𝙤𝙪𝙣𝙩 𝙢𝙖𝙠𝙞𝙣𝙜 𝙢𝙤𝙣𝙚𝙮 🤑💰
t.me/gold_free_signals1
Disclaimer
The information and publications are not meant to be, and do not constitute, financial, investment, trading, or other types of advice or recommendations supplied or endorsed by TradingView. Read more in the Terms of Use.
t.me/gold_free_signals1
𝙁𝙤𝙧𝙚𝙭 𝙩𝙧𝙖𝙙𝙞𝙣𝙜 𝙚𝙭𝙥𝙚𝙧𝙞𝙚𝙣𝙘𝙚 𝙩𝙚𝙖𝙢 ☺️ 𝙢𝙖𝙣𝙖𝙜𝙚 𝙮𝙤𝙪𝙧 𝙖𝙘𝙘𝙤𝙪𝙣𝙩 𝙢𝙖𝙠𝙞𝙣𝙜 𝙢𝙤𝙣𝙚𝙮 🤑💰
t.me/gold_free_signals1
𝙁𝙤𝙧𝙚𝙭 𝙩𝙧𝙖𝙙𝙞𝙣𝙜 𝙚𝙭𝙥𝙚𝙧𝙞𝙚𝙣𝙘𝙚 𝙩𝙚𝙖𝙢 ☺️ 𝙢𝙖𝙣𝙖𝙜𝙚 𝙮𝙤𝙪𝙧 𝙖𝙘𝙘𝙤𝙪𝙣𝙩 𝙢𝙖𝙠𝙞𝙣𝙜 𝙢𝙤𝙣𝙚𝙮 🤑💰
t.me/gold_free_signals1
Disclaimer
The information and publications are not meant to be, and do not constitute, financial, investment, trading, or other types of advice or recommendations supplied or endorsed by TradingView. Read more in the Terms of Use.