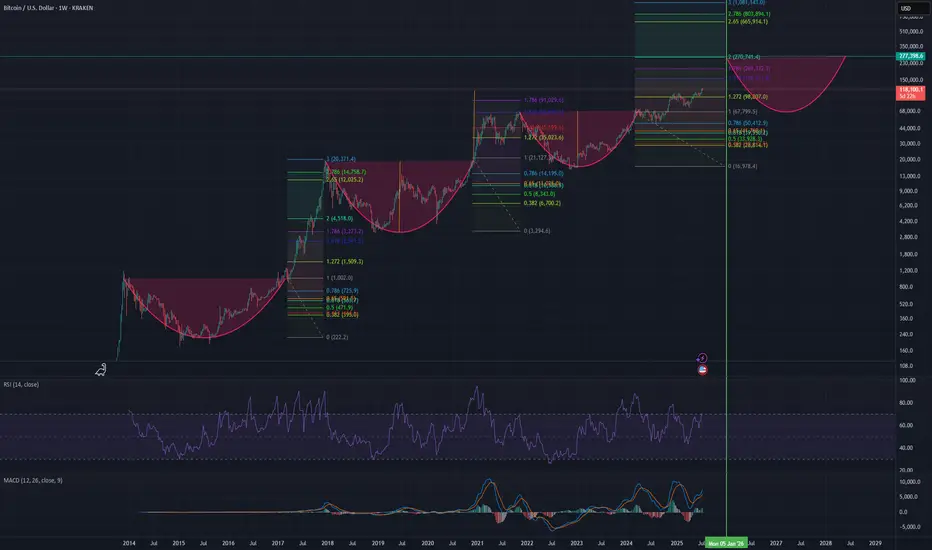
This "Bitcoin Cycle Prediction" chart utilizes a long-term logarithmic view of BTC/USD price action on a weekly timeframe (1W) via Kraken exchange data, highlighting the cyclical nature of Bitcoin's market behavior across past, present, and projected future cycles.
Key features include:
Parabolic Growth Curves: Three completed macro cycles and a fourth projected cycle are visualized with rounded cup-like formations, indicating historical accumulation phases followed by exponential bull runs.
Fibonacci Retracement & Extension Levels: Each major bull run is annotated with Fibonacci retracement and extension zones, helping identify historical resistance and support levels, as well as potential future price targets. Extensions like 1.618, 2.618, and 3.0 are used to forecast upper bounds.
RSI (Relative Strength Index) [14]: Positioned at the bottom, the RSI gives insight into historical overbought and oversold conditions, aligning well with the cycle peaks and troughs.
MACD (Moving Average Convergence Divergence): MACD crossovers and histogram movements reinforce the timing of bullish and bearish phases within each cycle.
Cycle Timing Marker: The vertical green line marks a projected inflection point around January 2026, suggesting the anticipated peak of the next bull cycle based on previous timing patterns.
Price Targets: Based on previous Fibonacci multiples, projected price targets for the upcoming cycle could reach extensions between $195,000 and $665,000+, if historical behavior repeats.
This chart is a speculative but historically informed visualization designed for educational and analytical purposes, offering long-term investors and cycle theorists a structured look at Bitcoin's repeating macro trends.
Disclaimer
The information and publications are not meant to be, and do not constitute, financial, investment, trading, or other types of advice or recommendations supplied or endorsed by TradingView. Read more in the Terms of Use.
Disclaimer
The information and publications are not meant to be, and do not constitute, financial, investment, trading, or other types of advice or recommendations supplied or endorsed by TradingView. Read more in the Terms of Use.