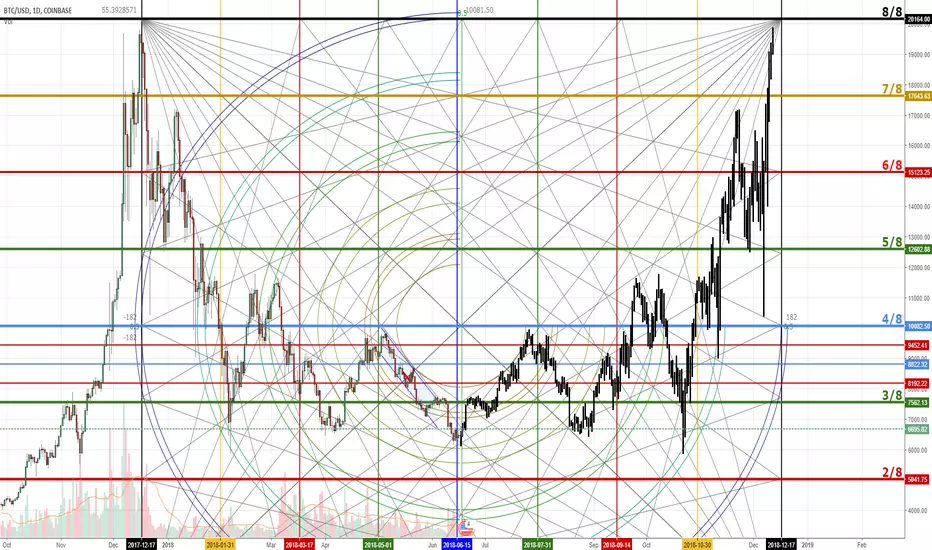
The image you are seeing is a rare (only because not many people use it) and old form of technical analysis from WD Gann's work: the Square of 52. The Square of 52 is a 52 week time cycle that begins at an important high or low, in this case the all time high of Bitcoin. What we have here is the exact center being traded, and it's at the bottom of a downtrend.
More than that, the mid point in the time cycle of the Square is also a 180-day Gann cycle. According to Gann, the 180-day cycle has these behaviors:
180 Day Cycle
Is the next most powerful cycle after 90
High probability of support or resistance
180 days up or down will usually start a countertrend movement or reverse the trend
180 days from all significant highs or lows must be watched for trend changes
Against extreme momentum and/or pitch, can go 192 days.
What we may observe is what the great analyst Michael S. Jenkins called a 'Mirrored Foldback'. If it doesn't trade it in structure, then it would trade it in shape, in this case the triangle. A foldback is a mirrored move in the structure that repeats its prior move. This is not an anamoly of the market, but a constant that we can see throught past price history.
Trade active
Mirrored Foldback still showing signs of continuation.Trade active
Mirrored foldback with the current price actionNote
Financial Astrology Dates associated with most recent price action. August 7th - Sun Square Jupiter
Red Vertical - August 23rd - Admetos Square Sun
Blue Vertical - August 24th - Uranus AND Saturn Trine Sun
Mars exits its retrograde cycle.
Trade active
After the monster drop, Bitcoin falls right inline with the Mirrored Foldback Pattern, this just created the swing low - we should observe some days of rising but choppy trades before the next massive blow out move beyond the most recent swing high in the 7400 value area.Trade active
Note
1. Gann arc acting as a support zone. 2. Long-term uptrend line below, alons with short term trend line.
3. New Moon phase started September 9th.
4. Pivot it in time on the 14th, well within the zone for a reversal based on that cycle.
Disclaimer
The information and publications are not meant to be, and do not constitute, financial, investment, trading, or other types of advice or recommendations supplied or endorsed by TradingView. Read more in the Terms of Use.
Disclaimer
The information and publications are not meant to be, and do not constitute, financial, investment, trading, or other types of advice or recommendations supplied or endorsed by TradingView. Read more in the Terms of Use.