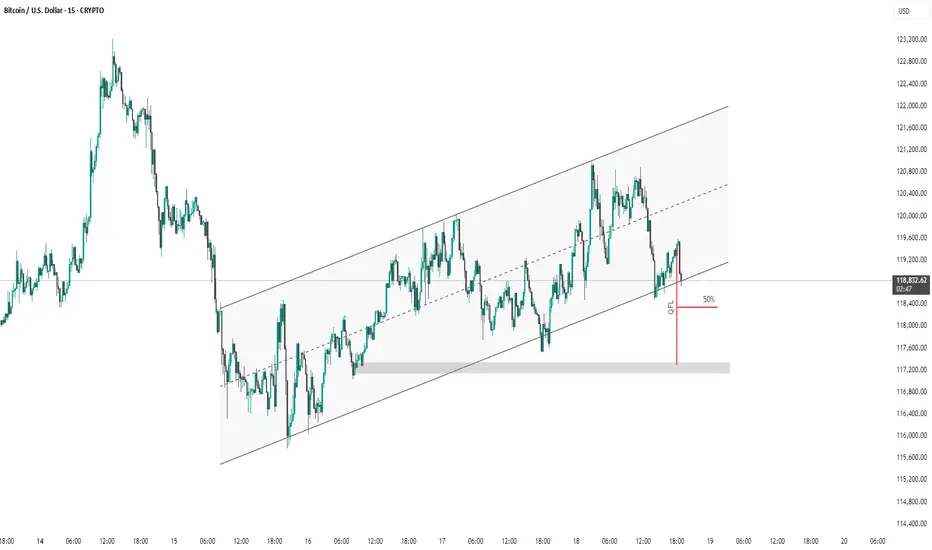
This 15-minute Bitcoin (BTC/USD) chart shows price action within an ascending channel. Recently, the price broke below the midline and touched the lower channel boundary, bouncing back slightly afterward. A marked "QFL" (Quick Flip Level) zone with a 50% retracement is highlighted, suggesting a potential area of interest for buyers or a price reaction point. The shaded region indicates strong demand/support around the $117,200–$118,000 range. A breakdown below this support could signal further bearish momentum.
thanking you
thanking you
Related publications
Disclaimer
The information and publications are not meant to be, and do not constitute, financial, investment, trading, or other types of advice or recommendations supplied or endorsed by TradingView. Read more in the Terms of Use.
Related publications
Disclaimer
The information and publications are not meant to be, and do not constitute, financial, investment, trading, or other types of advice or recommendations supplied or endorsed by TradingView. Read more in the Terms of Use.