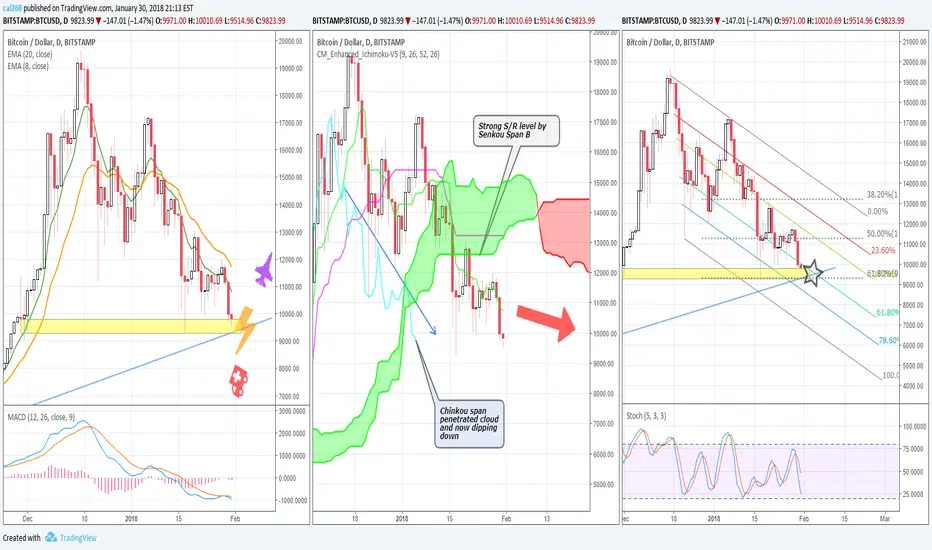
1st graph (the far left), Price tends to hit the support upward trendline today.
2nd graph (midde), Red cloud is getting thicker, and created a very strong resistance level at $14444.
3rd graph (the far right), Fib Channel 61.8% crosses Fib Ret 61.8% is so critical.
2nd graph (midde), Red cloud is getting thicker, and created a very strong resistance level at $14444.
3rd graph (the far right), Fib Channel 61.8% crosses Fib Ret 61.8% is so critical.
Related publications
Disclaimer
The information and publications are not meant to be, and do not constitute, financial, investment, trading, or other types of advice or recommendations supplied or endorsed by TradingView. Read more in the Terms of Use.
Related publications
Disclaimer
The information and publications are not meant to be, and do not constitute, financial, investment, trading, or other types of advice or recommendations supplied or endorsed by TradingView. Read more in the Terms of Use.