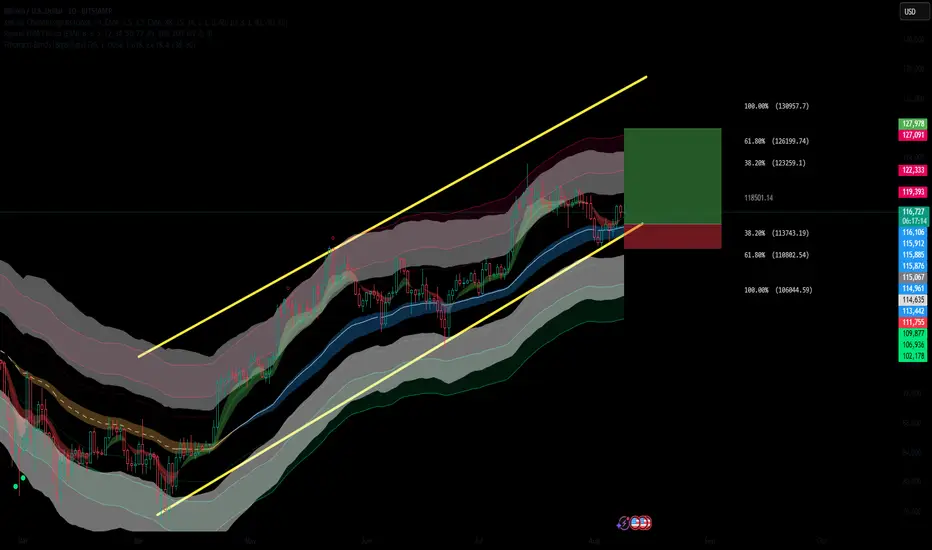
✅ Bullish Confluences:
Fibonacci Retracement Support: Price respected the 38.2%–61.8% Fib retracement zone between $113,769 and $110,828, confirming a strong demand area.
Trend Structure: Clear higher low formation on the daily chart, maintaining the bullish channel pattern.
EMA Cloud Support: Price remains above the multi-band EMA cloud, showing sustained bullish pressure and trend bias.
Channel Support: Bounce from the ascending channel’s lower trendline, keeping structure intact.
Bullish Candlestick Formation: Daily candle holding above key support with buying pressure evident.
Ideal entry would be between 113k and 114500.
🎯 Fibonacci-Based Targets:
TP1 – $123,285 (38.2%): Initial resistance and reaction zone.
TP2 – $126,225 (61.8%): Mid-extension target, aligns with prior swing high zone.
TP3 – $130,983 (100%): Full measured move to the channel top.
SL: Placed just below the 61.8% retracement (~$110,800), protecting against a breakdown of the bullish structure.
Trade active
Disclaimer
The information and publications are not meant to be, and do not constitute, financial, investment, trading, or other types of advice or recommendations supplied or endorsed by TradingView. Read more in the Terms of Use.
Disclaimer
The information and publications are not meant to be, and do not constitute, financial, investment, trading, or other types of advice or recommendations supplied or endorsed by TradingView. Read more in the Terms of Use.