Yesterday’s analysis: Rally should take us to the bottom of the triangle and the 128 day MA - around $7,600. Then pullback to $6,200. From there I expect us to find a base and rally back to $10,000. If you missed it I would highly recommend checking out the Bitcoin Bubble Comparison that was posted yesterday.
Patterns: higher low/diamond bottom. Inverse h&s with $7,835 target and $6,825 neckline
Horizontal support and resistance: R: $6,800 S: $6,676
BTCUSDSHORTS: Broke out of channel, but found resistance at 24,717. Hanging man on the daily. Expect 21,400 support to be retested
Funding Rates: Today longs will pay shorts 0.01%
12 & 26 EMA’s (calculate % difference): 12: +3.94% 26: +3.36% | Getting ready to make bullish crossover on daily for first time since 4/19. Recent bullish cross on 12h.
MA crossovers (50 and 128): Bullish on 1h. Getting ready to cross on 2h.
FIB’s: 0.382 at $8,476 and 0.236 at $5,817
Candlestick analysis:
Ichimoku Cloud: Kijun at $7,184. Cloud at $7,488. Fully bearish. 6h just broke out of cloud, had a bullish kumo twist, and is getting ready for a TK' cross.
TD' Sequential: Green 2 above a green 1 on the daily. Green 1 after a red 9 on the weekly. Green 8 on 12h.
Visible Range: Increasing resistance from here to $9,000
50 & 128 MA’s (calculate % difference): 50: Current candle is trying to breakthrough 128: -13.36%
BTC Price Spreadsheet: X
Bollinger Bands: Monthly MA is at $5,473 Weekly is starting to sqeeze. MA is at $7,738. Top band on daily is apart of resistance cluster at $6,800
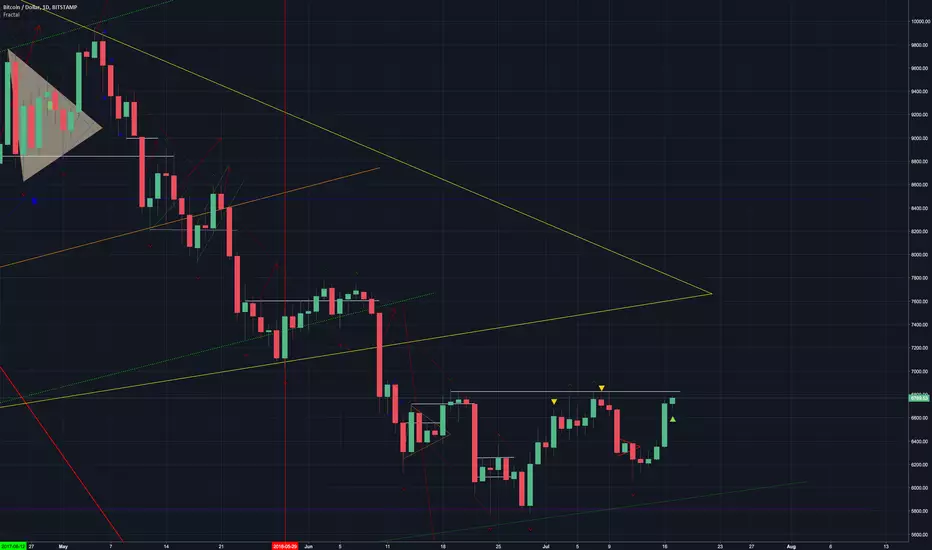
Trendline: Bull trend start at 9/15/17 and connect with 6/30/18 (green dotted). Bear trend was recently broken. Down trend from triangle will be at ~$7,600
Daily Trend: Bullish since 6/29
Fractals: UP: $6,822 DOWN: $6,075
On Balance Volume: Coming up with the price
Buy/Sell Sentiment on Trading View: RSI: 56.3 | Stoch: 70.5 | Short term MA’s showing buy signals.
Conclusion: Very confident in a pump to $7,500. Green 2 trading above a green 1 on the daily is providing an entry. I have set a stop order to long as soon as the price reaches $6,851. That will allow us to break through the major resistance at $6,800 and will still get us in a position with a favorable risk reward. Stop loss would be set at $6,474
Patterns: higher low/diamond bottom. Inverse h&s with $7,835 target and $6,825 neckline
Horizontal support and resistance: R: $6,800 S: $6,676
BTCUSDSHORTS: Broke out of channel, but found resistance at 24,717. Hanging man on the daily. Expect 21,400 support to be retested
Funding Rates: Today longs will pay shorts 0.01%
12 & 26 EMA’s (calculate % difference): 12: +3.94% 26: +3.36% | Getting ready to make bullish crossover on daily for first time since 4/19. Recent bullish cross on 12h.
MA crossovers (50 and 128): Bullish on 1h. Getting ready to cross on 2h.
FIB’s: 0.382 at $8,476 and 0.236 at $5,817
Candlestick analysis:
Ichimoku Cloud: Kijun at $7,184. Cloud at $7,488. Fully bearish. 6h just broke out of cloud, had a bullish kumo twist, and is getting ready for a TK' cross.
TD' Sequential: Green 2 above a green 1 on the daily. Green 1 after a red 9 on the weekly. Green 8 on 12h.
Visible Range: Increasing resistance from here to $9,000
50 & 128 MA’s (calculate % difference): 50: Current candle is trying to breakthrough 128: -13.36%
BTC Price Spreadsheet: X
Bollinger Bands: Monthly MA is at $5,473 Weekly is starting to sqeeze. MA is at $7,738. Top band on daily is apart of resistance cluster at $6,800
Trendline: Bull trend start at 9/15/17 and connect with 6/30/18 (green dotted). Bear trend was recently broken. Down trend from triangle will be at ~$7,600
Daily Trend: Bullish since 6/29
Fractals: UP: $6,822 DOWN: $6,075
On Balance Volume: Coming up with the price
Buy/Sell Sentiment on Trading View: RSI: 56.3 | Stoch: 70.5 | Short term MA’s showing buy signals.
Conclusion: Very confident in a pump to $7,500. Green 2 trading above a green 1 on the daily is providing an entry. I have set a stop order to long as soon as the price reaches $6,851. That will allow us to break through the major resistance at $6,800 and will still get us in a position with a favorable risk reward. Stop loss would be set at $6,474
Note
That didn't take very long : )Trade closed: target reached
emasar Indicator is available for purchase at alphanalysis.io/product/emasar/
Disclaimer
The information and publications are not meant to be, and do not constitute, financial, investment, trading, or other types of advice or recommendations supplied or endorsed by TradingView. Read more in the Terms of Use.