What is the stoch rsi?
The Stochastic RSI (Stoch RSI) is a momentum indicator that applies the stochastic oscillator to the RSI, making it more sensitive to price changes. The Stochastic RSI has two lines:
Blue line = the fast momentum line Orange line = the slower momentum line
How It Works:
* Helps identify overbought (above 80) and oversold (below 20) conditions.
* Crossing above 20 signals possible bullish momentum.
* Crossing below 80 signals possible bearish momentum.
Why Use It?
* Reacts faster than regular RSI.
* Helps spot momentum shifts and reversals.
* Best used with other indicators for confirmation.
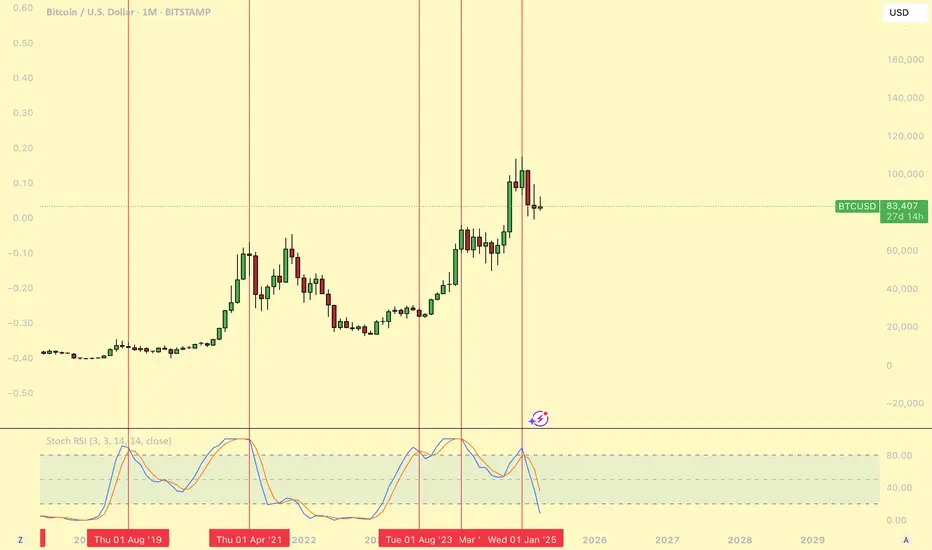
Analyzing the Monthly BTC Chart Through the Lens of Stochastic RSI: A Cycle Comparison
in this discussion, we’ll take a deep dive into the monthly Bitcoin (BTC) chart and examine how the Stochastic RSI aligns with previous market cycles, dating back to 2016. By comparing BTC’s historical price action with Stoch RSI signals, we aim to identify recurring patterns, overbought and oversold conditions, and how momentum shifts have played a role in past bull and bear markets. Understanding these correlations could provide valuable insights into where BTC currently stands in its broader cycle and what to expect next. Let’s break it down.
Let's dive into the bullmarket of 2016/2017:
In 2016 and 2017, the Stochastic RSI on the monthly BTC chart stayed consistently above the 80 level, often fluctuating between 80 and 100. During this period, the blue line occasionally crossed below the orange line, signaling a short-term pullback. When this cross occurred, it was typically followed by a red candle in the next month, indicating a brief dip before the price continued its upward movement. This pattern appeared multiple times throughout the bull market, allowing BTC to make higher highs and pushing the price further up.
However, the key turning point came when both the blue and orange lines crossed below the 80 level. This marked a shift in momentum, often leading to a significant drop in price or even a bear market phase. When the Stochastic RSI fell below 80 and remained there, it indicated that bullish momentum had stalled, and a potential reversal or prolonged downtrend was likely to follow. This was a critical signal for traders to watch during the bull cycle.

What happened in 2019-2021?
In 2019, the Stochastic RSI on the monthly BTC chart quickly moved from the oversold region to the overbought area, reflecting a rapid surge in BTC’s price during that time. This sharp movement in the Stochastic RSI mirrored the fast-paced price increase. However, once the Stochastic RSI entered the overbought zone, the blue line crossed below the orange line, signaling a potential reversal. When this happened, the Stochastic RSI fell below the 80 level, indicating that bullish momentum was weakening.
This crossover was a critical signal of potential downside, suggesting that BTC could experience a correction or even an extended period of bearish pressure. The decline in the Stochastic RSI below 80 marked the beginning of a phase where BTC faced increased downside momentum, leading to a correction in price for months.
Later in the cycle BTC and the Stoch RSI went up to the overbought area ones again. When the Stoch RSI with the blue and orange line crossed below the 80 was the start of a prolonged bear market.

What occured in this cycle?
In the current cycle of Bitcoin (BTC), there have been three notable crosses on the Stochastic RSI, which offer important insights into market conditions. The first cross stayed above the 80 level, which typically signals an overbought condition. When the Stochastic RSI is above 80, it indicates that the market may be experiencing strong bullish momentum, but it's also at risk of becoming overextended, potentially signaling a reversal.
However, the other two crosses occurred as the Stochastic RSI moved below the 80 level, which is generally interpreted as a sign that the bullish momentum is weakening and that further downside could be in play. The fact that these two crosses occurred below the 80 level suggests that the overbought conditions are being worked off, and momentum may be shifting to the downside.
The last cross is still in play. The momentum is quickly turning to the downside while BTC is facing downside pressure
How can we compare this cycle with the last ones?
In the last cycle of BTC, there were two key crosses of the Stochastic RSI below the 80 level, both of which marked important turning points for the market.
The first cross below the 80 level triggered a significant crash of around 70%, which was a sharp correction from the bull market's peak. This steep drop signified a clear shift in market sentiment, with the bearish trend beginning to take hold. The second cross below 80 marked the official start of the bear market, though it wasn’t as dramatic as the first crash.
An interesting aspect of the second cross was that Bitcoin briefly made a slightly higher high before the decline, which might have seemed like a potential sign of recovery or a continuation of the bullish trend. However, this higher high was not sustainable, and the bearish momentum quickly took over, confirming that the market had turned decisively to the downside. This higher high can often be seen as a bull trap, where traders were temporarily lured into thinking the market was rebounding, only for the price to reverse sharply.
In contrast, the cycle before this one was marked by Bitcoin staying consistently above the 80 level for the entire duration of the bull market. The Stochastic RSI remained elevated, reflecting strong bullish momentum and a prolonged uptrend. Once the Stochastic RSI crossed below the 80 level, it signaled the official start of the bear market. This transition from above to below 80 is often seen as a clear indication that the overbought conditions had been worked off, and the market was beginning to lose its bullish steam.
In both cycles, the Stochastic RSI's behavior has been crucial in identifying key points where the market shifted from bullish to bearish. In the most recent cycle, the sharp crash following the first cross below 80 and the subsequent bear market beginning with the second cross below 80 highlight the significance of this indicator in forecasting major market changes. Meanwhile, in the previous cycle, the sustained time spent above 80 helped to keep the bullish momentum intact until the market finally reversed with that pivotal cross below 80.
These patterns suggest that once Bitcoin’s Stochastic RSI starts crossing below the 80 level after an extended period of bullish movement, it’s a strong signal that the market is entering a phase of weakness and may eventually lead to a bear market.
Conclusion:
The current cycle shows similarities to the 2019/2021 cycle, particularly with the second cross down on the Stochastic RSI, which previously marked a local top. There is a strong possibility that this could signal a cycle top.
Thanks for your support.
- Make sure to follow me so you don't miss out on the next analysis!
- Drop a like and leave a comment!
The Stochastic RSI (Stoch RSI) is a momentum indicator that applies the stochastic oscillator to the RSI, making it more sensitive to price changes. The Stochastic RSI has two lines:
Blue line = the fast momentum line Orange line = the slower momentum line
How It Works:
* Helps identify overbought (above 80) and oversold (below 20) conditions.
* Crossing above 20 signals possible bullish momentum.
* Crossing below 80 signals possible bearish momentum.
Why Use It?
* Reacts faster than regular RSI.
* Helps spot momentum shifts and reversals.
* Best used with other indicators for confirmation.
Analyzing the Monthly BTC Chart Through the Lens of Stochastic RSI: A Cycle Comparison
in this discussion, we’ll take a deep dive into the monthly Bitcoin (BTC) chart and examine how the Stochastic RSI aligns with previous market cycles, dating back to 2016. By comparing BTC’s historical price action with Stoch RSI signals, we aim to identify recurring patterns, overbought and oversold conditions, and how momentum shifts have played a role in past bull and bear markets. Understanding these correlations could provide valuable insights into where BTC currently stands in its broader cycle and what to expect next. Let’s break it down.
Let's dive into the bullmarket of 2016/2017:
In 2016 and 2017, the Stochastic RSI on the monthly BTC chart stayed consistently above the 80 level, often fluctuating between 80 and 100. During this period, the blue line occasionally crossed below the orange line, signaling a short-term pullback. When this cross occurred, it was typically followed by a red candle in the next month, indicating a brief dip before the price continued its upward movement. This pattern appeared multiple times throughout the bull market, allowing BTC to make higher highs and pushing the price further up.
However, the key turning point came when both the blue and orange lines crossed below the 80 level. This marked a shift in momentum, often leading to a significant drop in price or even a bear market phase. When the Stochastic RSI fell below 80 and remained there, it indicated that bullish momentum had stalled, and a potential reversal or prolonged downtrend was likely to follow. This was a critical signal for traders to watch during the bull cycle.
What happened in 2019-2021?
In 2019, the Stochastic RSI on the monthly BTC chart quickly moved from the oversold region to the overbought area, reflecting a rapid surge in BTC’s price during that time. This sharp movement in the Stochastic RSI mirrored the fast-paced price increase. However, once the Stochastic RSI entered the overbought zone, the blue line crossed below the orange line, signaling a potential reversal. When this happened, the Stochastic RSI fell below the 80 level, indicating that bullish momentum was weakening.
This crossover was a critical signal of potential downside, suggesting that BTC could experience a correction or even an extended period of bearish pressure. The decline in the Stochastic RSI below 80 marked the beginning of a phase where BTC faced increased downside momentum, leading to a correction in price for months.
Later in the cycle BTC and the Stoch RSI went up to the overbought area ones again. When the Stoch RSI with the blue and orange line crossed below the 80 was the start of a prolonged bear market.
What occured in this cycle?
In the current cycle of Bitcoin (BTC), there have been three notable crosses on the Stochastic RSI, which offer important insights into market conditions. The first cross stayed above the 80 level, which typically signals an overbought condition. When the Stochastic RSI is above 80, it indicates that the market may be experiencing strong bullish momentum, but it's also at risk of becoming overextended, potentially signaling a reversal.
However, the other two crosses occurred as the Stochastic RSI moved below the 80 level, which is generally interpreted as a sign that the bullish momentum is weakening and that further downside could be in play. The fact that these two crosses occurred below the 80 level suggests that the overbought conditions are being worked off, and momentum may be shifting to the downside.
The last cross is still in play. The momentum is quickly turning to the downside while BTC is facing downside pressure
How can we compare this cycle with the last ones?
In the last cycle of BTC, there were two key crosses of the Stochastic RSI below the 80 level, both of which marked important turning points for the market.
The first cross below the 80 level triggered a significant crash of around 70%, which was a sharp correction from the bull market's peak. This steep drop signified a clear shift in market sentiment, with the bearish trend beginning to take hold. The second cross below 80 marked the official start of the bear market, though it wasn’t as dramatic as the first crash.
An interesting aspect of the second cross was that Bitcoin briefly made a slightly higher high before the decline, which might have seemed like a potential sign of recovery or a continuation of the bullish trend. However, this higher high was not sustainable, and the bearish momentum quickly took over, confirming that the market had turned decisively to the downside. This higher high can often be seen as a bull trap, where traders were temporarily lured into thinking the market was rebounding, only for the price to reverse sharply.
In contrast, the cycle before this one was marked by Bitcoin staying consistently above the 80 level for the entire duration of the bull market. The Stochastic RSI remained elevated, reflecting strong bullish momentum and a prolonged uptrend. Once the Stochastic RSI crossed below the 80 level, it signaled the official start of the bear market. This transition from above to below 80 is often seen as a clear indication that the overbought conditions had been worked off, and the market was beginning to lose its bullish steam.
In both cycles, the Stochastic RSI's behavior has been crucial in identifying key points where the market shifted from bullish to bearish. In the most recent cycle, the sharp crash following the first cross below 80 and the subsequent bear market beginning with the second cross below 80 highlight the significance of this indicator in forecasting major market changes. Meanwhile, in the previous cycle, the sustained time spent above 80 helped to keep the bullish momentum intact until the market finally reversed with that pivotal cross below 80.
These patterns suggest that once Bitcoin’s Stochastic RSI starts crossing below the 80 level after an extended period of bullish movement, it’s a strong signal that the market is entering a phase of weakness and may eventually lead to a bear market.
Conclusion:
The current cycle shows similarities to the 2019/2021 cycle, particularly with the second cross down on the Stochastic RSI, which previously marked a local top. There is a strong possibility that this could signal a cycle top.
Thanks for your support.
- Make sure to follow me so you don't miss out on the next analysis!
- Drop a like and leave a comment!
🔸 Free trading Discord
discord.gg/fVfJHHQSMG
🔹 Free trading signals
t.me/CandleCollective
discord.gg/fVfJHHQSMG
🔹 Free trading signals
t.me/CandleCollective
Disclaimer
The information and publications are not meant to be, and do not constitute, financial, investment, trading, or other types of advice or recommendations supplied or endorsed by TradingView. Read more in the Terms of Use.