In this chart we're looking at a few different things but with a positive sentiment overall.
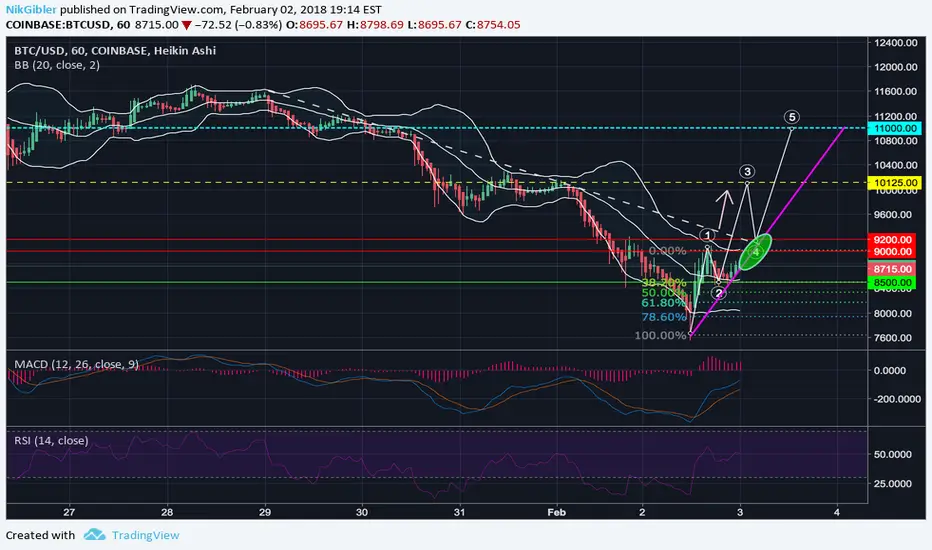
It's been a hell of a ride in the last 24 hours and we need all of the information we can get. So let's get right to it. After dipping to about $7500 early this morning, the bulls finally came out to play and we got the trend reversal we were so eager to see.
(A) Support is now at $8500.00 (Green Line)
(B) Resistance is being observed between $9000.00-$9200.00 (Red Lines)
(C) Next target should be $10125.00 (where we've seen heavy resistance in the last 24 hours. (Yellow Dotted Line)
(D) The new trend support line can be observed on the chart as (Magenta Line)
(E) The MACD is on an upward trend.
(F) The RSI is hovering at around 50 but consistently with the MACD, it is also on a slow upward trend.
(G) The climb from this morning's bottom-out ($7500) to the current resistance point has retraced to a very optimistic 38.2% FIB level. This should keep the bulls happy. (continue reading on next page...)
(H) Once we break out of the (B) resistance levels, we will also be breaking out of the bearish trend/channel resistance (as seen by the dashed gray line that began on January 29th. This should send us easily on our way to our new resistance of $10125.00.
(I) Currently we are navigating in the upper portion of the Bollinger Band indicator, which could potentially mean, a small correctory movement, which I personally wouldn’t be too worried about.
(J) The final resistance in our current wave impulse cycle will be seen when we reach $11000 (Dotted Blue Line), at which point we will begin the corresponding 3-point correction/retracement.
(K) The most crucial moment will come when we reach the area in the GREEN highlighted ellipse. Where many trend lines, supports, and fib levels coincide. Looking forward to it.
*
As always, I recommend for every one to further expand their knowledge and do as much research as possible when investing. These are my own personal opinions and should be considered educational resources rather than financial advice. Good luck out there cryptonauts.
Disclaimer
The information and publications are not meant to be, and do not constitute, financial, investment, trading, or other types of advice or recommendations supplied or endorsed by TradingView. Read more in the Terms of Use.
Disclaimer
The information and publications are not meant to be, and do not constitute, financial, investment, trading, or other types of advice or recommendations supplied or endorsed by TradingView. Read more in the Terms of Use.