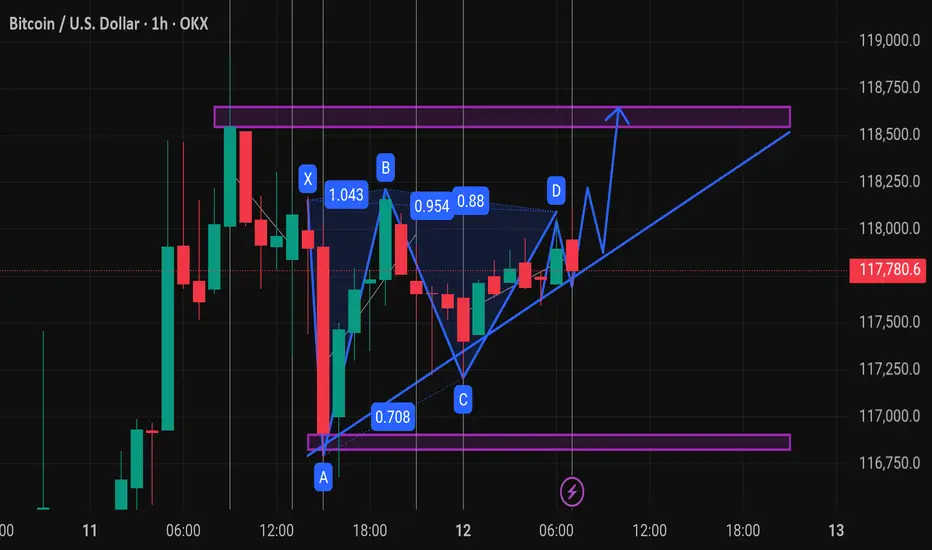
This chart displays a 1-hour candlestick analysis for Bitcoin (BTC/USD) on OKX, with a focus on harmonic pattern recognition and technical price projections.
Here's a breakdown of what the chart suggests:
---
🔷 Harmonic Pattern: Potential Bullish Bat or Gartley
The marked XABCD structure appears to form a harmonic pattern, likely a Bullish Gartley or Bat:
XA: Initial impulse leg.
AB: Retraces ~61.8–78.6% of XA.
BC: Retraces ~38.2–88.6% of AB.
CD: Extends to complete the pattern near the D point.
✅ Ratios like:
AB ≈ 0.618–0.786 of XA
BC ≈ 0.618–0.886 of AB
CD ≈ 1.272–1.618 of BC support this classification.
---
📈 **Ascending Triangle
🎯XAUUSD GOLD Daily 8-9 Free Signals🚀 World Best community Join Here ✅
💫XAUUSD
💫BTC
💫EURUSD
For Signals Telegram channel
⬇️⬇️⬇️⬇️⬇️⬇️⬇️⬇️⬇️⬇️⬇️⬇️⬇️
t.me/technicaltrader10
💫XAUUSD
💫BTC
💫EURUSD
For Signals Telegram channel
⬇️⬇️⬇️⬇️⬇️⬇️⬇️⬇️⬇️⬇️⬇️⬇️⬇️
t.me/technicaltrader10
Disclaimer
The information and publications are not meant to be, and do not constitute, financial, investment, trading, or other types of advice or recommendations supplied or endorsed by TradingView. Read more in the Terms of Use.