Perfect — let’s break down your BTC/USD (Bitcoin vs US Dollar) 1H chart in detail.
Chart Analysis
1. Market Context
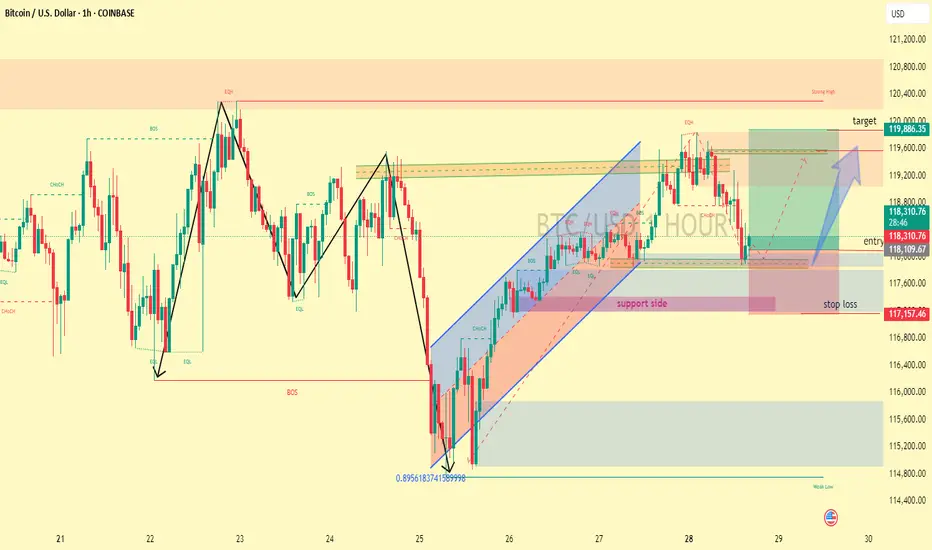
The price action shows strong bullish recovery after a breakdown, with Bitcoin moving inside an ascending channel (highlighted in blue).
The channel support side has been tested recently, and buyers defended it.
2. Key Levels
Entry Zone: Around 118,300 – 118,400 (where price currently sits).
Stop Loss: Below 117,150 (red zone).
Target: Around 119,800 – 120,000 (highlighted in green with resistance).
---
3. Price Structure
Multiple Break of Structure (BOS) labels show shifts in momentum.
The last BOS was bullish, supporting the idea of continuation to the upside.
There’s also a liquidity grab below minor equal lows (EQL), followed by a recovery — a common bullish sign.
---
4. Setup Idea
Trade Bias: Bullish (Buy Setup)
Logic:
Price tapped the support side of the channel.
Rejection from demand zone (purple) shows
Chart Analysis
1. Market Context
The price action shows strong bullish recovery after a breakdown, with Bitcoin moving inside an ascending channel (highlighted in blue).
The channel support side has been tested recently, and buyers defended it.
2. Key Levels
Entry Zone: Around 118,300 – 118,400 (where price currently sits).
Stop Loss: Below 117,150 (red zone).
Target: Around 119,800 – 120,000 (highlighted in green with resistance).
---
3. Price Structure
Multiple Break of Structure (BOS) labels show shifts in momentum.
The last BOS was bullish, supporting the idea of continuation to the upside.
There’s also a liquidity grab below minor equal lows (EQL), followed by a recovery — a common bullish sign.
---
4. Setup Idea
Trade Bias: Bullish (Buy Setup)
Logic:
Price tapped the support side of the channel.
Rejection from demand zone (purple) shows
Note
half of the target is achieved successfully hit 110+ pips Trade closed: stop reached
Sorry guys for late update, now market goes in our favour but dont target hit . around 115+PIPS in profit. then STOP LOSS hit . sorry for this ready for next target.Best Analysis xauusd single
t.me/+uAIef7IqwSs4M2Q0
VIP PREMIMUM ANALYSIS ROOM SIGNALS
t.me/+uAIef7IqwSs4M2Q0
t.me/+uAIef7IqwSs4M2Q0
VIP PREMIMUM ANALYSIS ROOM SIGNALS
t.me/+uAIef7IqwSs4M2Q0
Disclaimer
The information and publications are not meant to be, and do not constitute, financial, investment, trading, or other types of advice or recommendations supplied or endorsed by TradingView. Read more in the Terms of Use.
Best Analysis xauusd single
t.me/+uAIef7IqwSs4M2Q0
VIP PREMIMUM ANALYSIS ROOM SIGNALS
t.me/+uAIef7IqwSs4M2Q0
t.me/+uAIef7IqwSs4M2Q0
VIP PREMIMUM ANALYSIS ROOM SIGNALS
t.me/+uAIef7IqwSs4M2Q0
Disclaimer
The information and publications are not meant to be, and do not constitute, financial, investment, trading, or other types of advice or recommendations supplied or endorsed by TradingView. Read more in the Terms of Use.