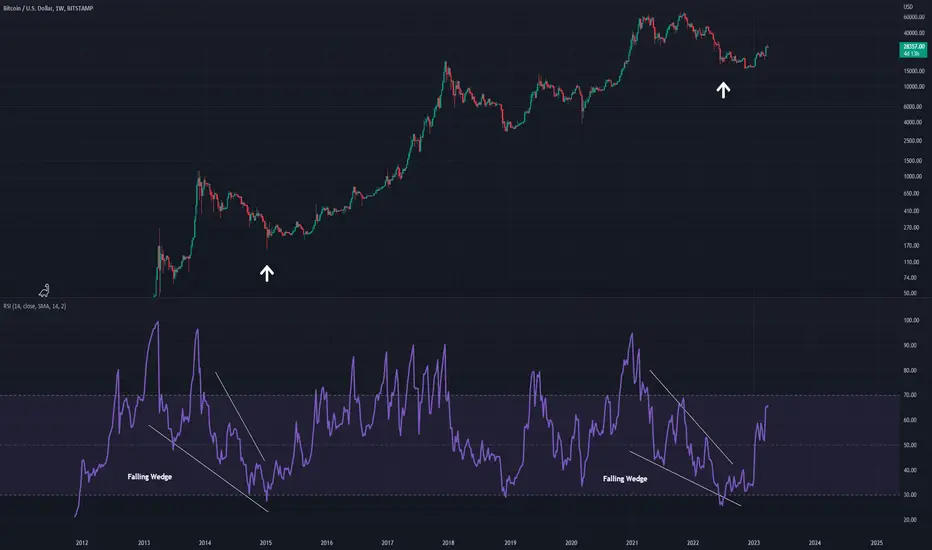
Falling wedge patterns present on the RSI may indicate comparable bull runs between the one seen in 2017 and the one we are about to see coming.
Arrows on the BTC chart to show the bottom points and where the run begins.
Arrows on the BTC chart to show the bottom points and where the run begins.
Disclaimer
The information and publications are not meant to be, and do not constitute, financial, investment, trading, or other types of advice or recommendations supplied or endorsed by TradingView. Read more in the Terms of Use.
Disclaimer
The information and publications are not meant to be, and do not constitute, financial, investment, trading, or other types of advice or recommendations supplied or endorsed by TradingView. Read more in the Terms of Use.