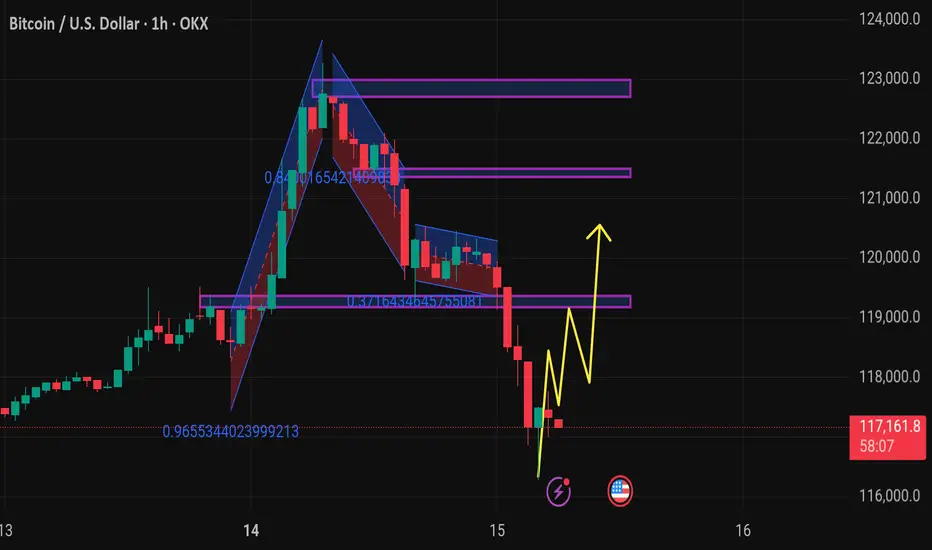
This chart shows the Bitcoin (BTC) / USD 1-hour timeframe on OKX, with several technical analysis elements:
Key Observations:
1. Price Action:
Current price: $117,334.1, showing a −2.14% decline.
Price has dropped from around $123,000 down to $117,000, indicating a sharp bearish movement.
2. Harmonic/Pattern Zones:
The chart contains harmonic pattern structures with Fibonacci ratios:
The large upswing has a retracement level of 0.9655, nearly a full retracement.
A downward channel/retracement touches 0.8416, indicating a deep pullback.
Another smaller retracement at 0.3716, a shallower correction.
3. Support and Resistance Zones:
Multiple horizontal purple zones mark areas of past price reactions:
Around 121,000, 119,000, and 117,000 levels.
Price is currently testing the 117,000 support zone.
4. Projected Price Path (Yellow Arrows):
The projected movement shows a potential bullish recovery:
Minor pullbacks are expected, followed by higher highs.
The target appears to aim back toward the 119,000 – 120,000 resistance zone.
5. Icons on Chart
🎯XAUUSD GOLD Daily 8-9 Free Signals🚀 World Best community Join Here ✅
💫XAUUSD
💫BTC
💫EURUSD
For Signals Telegram channel
⬇️⬇️⬇️⬇️⬇️⬇️⬇️⬇️⬇️⬇️⬇️⬇️⬇️
t.me/technicaltrader10
💫XAUUSD
💫BTC
💫EURUSD
For Signals Telegram channel
⬇️⬇️⬇️⬇️⬇️⬇️⬇️⬇️⬇️⬇️⬇️⬇️⬇️
t.me/technicaltrader10
Disclaimer
The information and publications are not meant to be, and do not constitute, financial, investment, trading, or other types of advice or recommendations supplied or endorsed by TradingView. Read more in the Terms of Use.