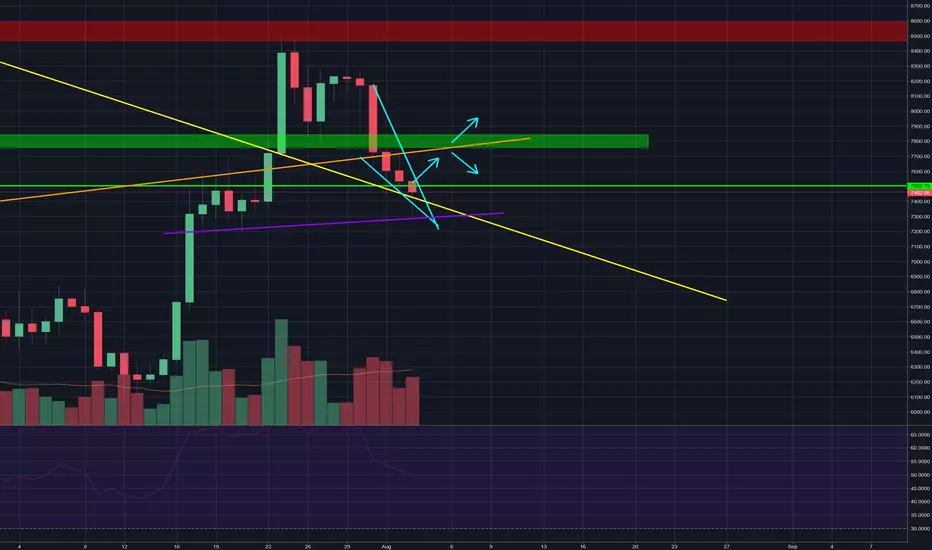
It looks like there is a descending wedge (light blue) that occurred with a 4 hour bullish divergence that occurred at around 7300. The bulls did a really good job defending 7300, and the bears were showing a lot of weakness, however, it was on the fence if the bulls could recover from that drop, but they did and right now the bulls control the field. The movements down got rejected by the yellow support line which should be an extremely strong support, extremely strong, because that has been the resistance like for the past 8 months, and the orange line which used to be the support of the symmetrical triangle is now the resistance, and this descending wedge has a price objective that shoots right under, right under 7850. Depending on whether the bulls can dominate the area, depends on whether this recent breakout was a false one or not, because if the bulls get rejected at 7800 or something lower than that, then it is most likely going to be the head and shoulder topping pattern I have been talking about in the last idea. The bulls are trying on this one with a solid possible reversal, and a possible reversal on the daily with a nice bullish hammer candle stick.
Key Points:
1.) Daily candle stick shows several bullish reversal candle stick patterns, the first one is a 5 count fractal reversal, the second one is a really superb, strong bullish hammer. It bounced off of the yellow trendline, with a bullish divergence on the 4 hour candle sticks and the bulls have been doing a good steady job at keeping this price up.
2.) There is a bullish continuation pattern, the descending wedge, and it looks legitimate and it is confirmed on the daily with volume; it is also confirmed on the smaller time frames, however on the smaller time frames the descending wedge is much larger. The main problem is that patterns have been failing because we are moving sideways at the moment and we are technically trendless right now, also the market is in a strange place right now as this is a huge decrease in total market cap with some coins virtually at zero and others on the brink of it.
3.) If the descending wedge succeeds then then it is up to the bulls break 7850 with significant strength and penetration for me to say we are in bullish territory, a failure to break through the 7850 levels would mean it would be the right shoulder of the inverse head and shoulder with the neckline (readjusted from before) in purple.
Disclaimer
The information and publications are not meant to be, and do not constitute, financial, investment, trading, or other types of advice or recommendations supplied or endorsed by TradingView. Read more in the Terms of Use.
Disclaimer
The information and publications are not meant to be, and do not constitute, financial, investment, trading, or other types of advice or recommendations supplied or endorsed by TradingView. Read more in the Terms of Use.