Good morning, traders. Price has moved sideways, extending the local TR, since yesterday but we may be nearing upward momentum as I'll explain below.
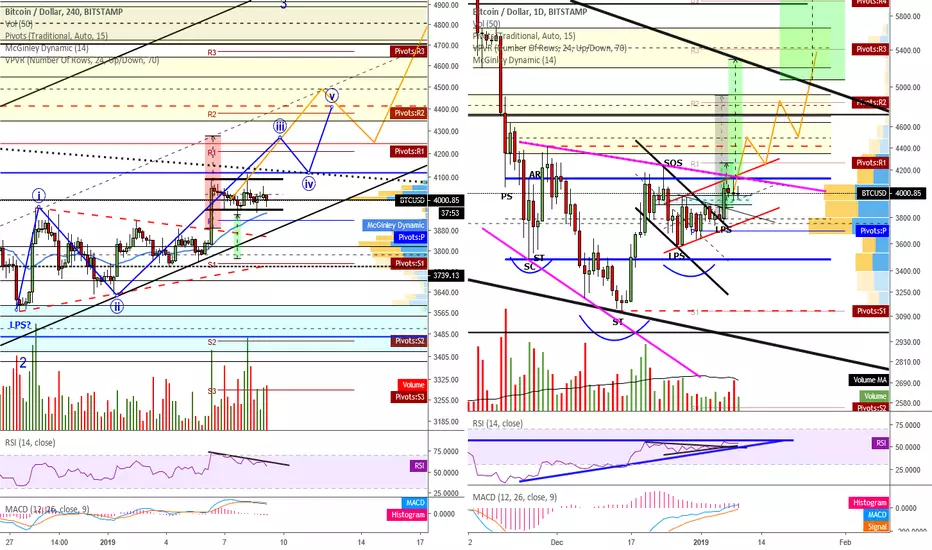
H4 chart:
MACD's histogram is printing hidden bullish divergence between 1/5/19 at 10 p.m. and the current candle. We can see higher lows between those two price points, but the histogram is printing lower lows. Hidden bullish divergence is a bullish continuation indication so we should expect price to push higher sooner rather than later. This divergence will be invalidated if price drops below $3780. Hidden bullish divergence would suggest that the horizontal TR that price has been in since the top of the impulsive candle on 1/6/19 is re-accumulation in anticipation of pushing up and through the major resistance just overhead, setting up the move up to the low-to-mid $5000s. I am watching for RSI to push through resistance which should be the point at which price makes the move through its own resistance. The McGinley Dynamic is still below price which is a positive sign for now. A close above the recent swing high at $4112 should have price moving upward toward the higher targets as it would be a break of the descending resistance that has been keeping price in check for the past 2.5 weeks or so. A close below the swing low at $3934.73 would have me watching the $3750/$3800 level for support. Failure of that level to support price is a strong indication that we may be headed to the 2018 low once more.
D1 chart:
RSI is nearing a break of a key level that it hasn't been above since August/September of last year. If it breaks this level, denoted by the horizontal blue line, then we should expect price to be breaking through its major nearby overhead resistance as well. Yesterday's volume was just shy of the December 29th volume as I suggested it was likely to be near or potentially even break. Bears are calling for people to short this because they believe it has already failed. While it is a possibility, I would be wary of shorting without confirmation as the overhead resistance is strong so this could also be nothing more than consolidation to gain the strength needed to push through that resistance. Many bears got burned terribly during the April short squeeze by not waiting for confirmation. The significance of a break of the overhead resistance shouldn't be underestimated as the 50 EMA is sitting right on top of price so that kind of movement would put price on top of that EMA which is strongly bullish.
Every day, we have a choice to act positively or negatively, so if you get a chance, do something decent for someone today which could be as simple as sharing a nice word with them. You just might change their day, or even their life.
Remember, you can always click on the "share" button in the lower right hand of the screen, under the chart, and then click on "Make it mine" from the popup menu in order to get a live version of the chart that you can explore on your own.
Disclaimer
The information and publications are not meant to be, and do not constitute, financial, investment, trading, or other types of advice or recommendations supplied or endorsed by TradingView. Read more in the Terms of Use.
Disclaimer
The information and publications are not meant to be, and do not constitute, financial, investment, trading, or other types of advice or recommendations supplied or endorsed by TradingView. Read more in the Terms of Use.