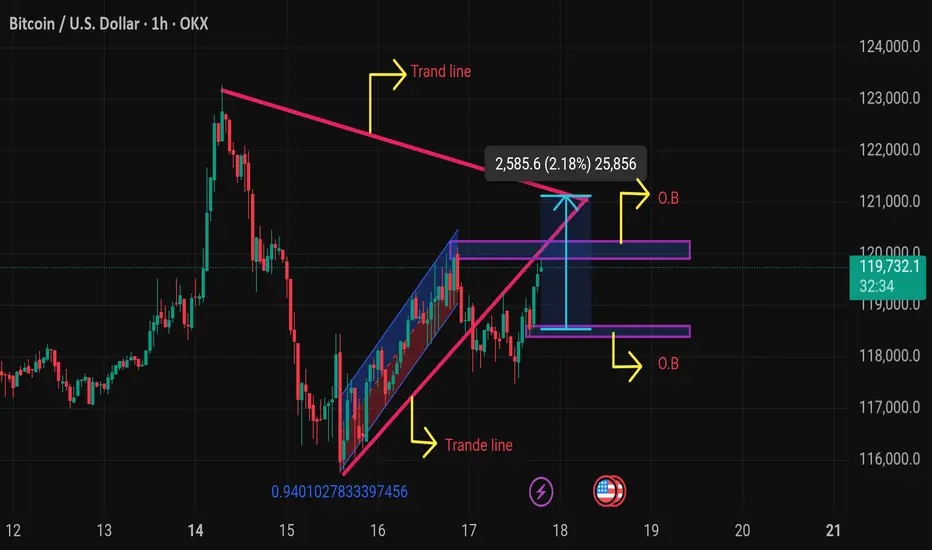
The chart shows a BTC/USD (Bitcoin vs. US Dollar) technical analysis on the 1-hour timeframe. Here's a detailed breakdown:
---
🔍 Chart Elements & Interpretation:
1. Trend Lines:
Upper Pink Trend Line: Acts as a resistance from a previous high.
Lower Pink Trend Line: Represents a support line from the recent upward trend.
Blue Channel: Shows a rising wedge or ascending channel (often a bearish reversal pattern).
2. O.B (Order Blocks):
Upper O.B Zone (~120,000–121,000): Potential supply zone or area of resistance.
Lower O.B Zone (~117,500–118,500): Possible demand zone or support.
3. Price Projection:
A measured move of 2,585.6 points (2.18%) is marked upward from the current breakout attempt.
4. Current Price:
BTC is trading at $119,771.8, with a +0.90% increase at the time of this chart.
---
🧠 Technical Outlook:
Bullish Case:
Breakout above the upper trend line and clearing the upper O.B could lead to a continuation toward 122,000+.
If BTC respects the demand zone and bounces, the uptrend may resume.
Bearish Case:
Failure to break above resistance or rejection at
---
🔍 Chart Elements & Interpretation:
1. Trend Lines:
Upper Pink Trend Line: Acts as a resistance from a previous high.
Lower Pink Trend Line: Represents a support line from the recent upward trend.
Blue Channel: Shows a rising wedge or ascending channel (often a bearish reversal pattern).
2. O.B (Order Blocks):
Upper O.B Zone (~120,000–121,000): Potential supply zone or area of resistance.
Lower O.B Zone (~117,500–118,500): Possible demand zone or support.
3. Price Projection:
A measured move of 2,585.6 points (2.18%) is marked upward from the current breakout attempt.
4. Current Price:
BTC is trading at $119,771.8, with a +0.90% increase at the time of this chart.
---
🧠 Technical Outlook:
Bullish Case:
Breakout above the upper trend line and clearing the upper O.B could lead to a continuation toward 122,000+.
If BTC respects the demand zone and bounces, the uptrend may resume.
Bearish Case:
Failure to break above resistance or rejection at
🎯XAUUSD GOLD Daily 8-9 Free Signals🚀 World Best community Join Here ✅
💫XAUUSD
💫BTC
💫EURUSD
For Signals Telegram channel
⬇️⬇️⬇️⬇️⬇️⬇️⬇️⬇️⬇️⬇️⬇️⬇️⬇️
t.me/technicaltrader10
💫XAUUSD
💫BTC
💫EURUSD
For Signals Telegram channel
⬇️⬇️⬇️⬇️⬇️⬇️⬇️⬇️⬇️⬇️⬇️⬇️⬇️
t.me/technicaltrader10
Disclaimer
The information and publications are not meant to be, and do not constitute, financial, investment, trading, or other types of advice or recommendations supplied or endorsed by TradingView. Read more in the Terms of Use.