After the long and steep rally in Bitcoin that began on April 9th, the price is now entering a period of consolidation and forming a classic bullish continuation pattern known as a bull flag. This type of structure often appears after a strong impulsive move to the upside and signals that the market may be gearing up for another leg higher.
Bull Flag
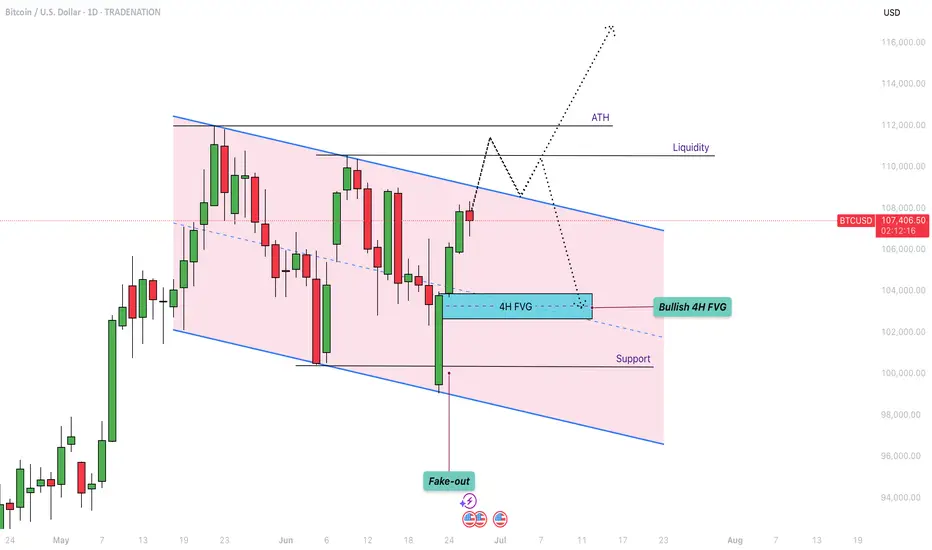
On the daily timeframe, BTC is in the process of developing a bull flag by printing a series of lower highs and lower lows within a narrow descending channel. This pullback phase comes after a significant rally and is generally considered a healthy part of a trending market. It reflects a cooling-off period in which the market digests the prior gains while maintaining a bullish bias. This type of structure typically resolves to the upside, continuing the dominant trend. At present, BTC is approaching a key upper boundary of the flag formation, which also aligns with a prior zone of price rejection. This area could act as resistance in the short term and will likely play a crucial role in determining the next directional move.
4H Fair Value Gap
Zooming in on the 4-hour chart, we can observe a clearly defined fair value gap (FVG) between the $102,700 and $103,800 levels. This imbalance was created during the sharp move up and now represents a potential area of interest for buyers. If price retraces into this zone, it could act as strong support where demand steps in, filling the imbalance and potentially triggering the next upward leg. Fair value gaps often serve as magnet zones in trending markets, and in this case, could offer a key entry point for those looking to position long within the larger bullish structure.
Liquidity Levels
One of the more critical areas to watch lies around the $111,000 level, where we see a double top on the lower timeframes. This region holds a significant amount of resting liquidity just above it, as evidenced by the liquidation heatmap. These clustered stop-loss orders and leveraged positions create a liquidity pool that could attract market makers and large players looking to trigger a stop run. As price approaches this level, it becomes increasingly likely that the market may spike into this liquidity before deciding on a longer-term direction. This liquidity zone acts like a magnet and is a common target for short-term wicks and fake-out moves.
Expectations
The current expectation is for Bitcoin to push higher toward the $111,000 level before the market makes a more definitive move. While this upside continuation seems likely in the short term, caution is warranted, especially considering the structure on higher timeframes. The weekly chart is starting to show some signs of exhaustion, with momentum slowing and potential bearish divergence forming. As such, the move to $111,000 could simply be a liquidity grab—a final push to trap breakout traders—before a deeper correction or reversal unfolds. If price does manage to break the all-time high with convincing volume and sustained follow-through, the bullish case would strengthen significantly. Until then, however, it’s important to remain cautious and recognize the risk of a fake-out at these elevated levels.
Conclusion
Despite the strong rally in recent weeks, Bitcoin still faces substantial resistance overhead. The $111,000 level stands out as a critical zone that could act as a magnet, drawing in price action before reversing to the downside. This area is not only technically significant but also loaded with liquidity, increasing the risk of a bull trap. Traders should remain vigilant and avoid getting caught on the wrong side of the move. Watch closely for signs of exhaustion or divergence as price approaches this level, and be prepared for potential fake-outs designed to lure in overly aggressive participants. Staying patient and waiting for confirmation remains the most prudent strategy in this environment.
-------------------------------
Disclosure: I am part of Trade Nation's Influencer program and receive a monthly fee for using their TradingView charts in my analysis.
Thanks for your support.
- Make sure to follow me so you don't miss out on the next analysis!
- Drop a like and leave a comment!
Bull Flag
On the daily timeframe, BTC is in the process of developing a bull flag by printing a series of lower highs and lower lows within a narrow descending channel. This pullback phase comes after a significant rally and is generally considered a healthy part of a trending market. It reflects a cooling-off period in which the market digests the prior gains while maintaining a bullish bias. This type of structure typically resolves to the upside, continuing the dominant trend. At present, BTC is approaching a key upper boundary of the flag formation, which also aligns with a prior zone of price rejection. This area could act as resistance in the short term and will likely play a crucial role in determining the next directional move.
4H Fair Value Gap
Zooming in on the 4-hour chart, we can observe a clearly defined fair value gap (FVG) between the $102,700 and $103,800 levels. This imbalance was created during the sharp move up and now represents a potential area of interest for buyers. If price retraces into this zone, it could act as strong support where demand steps in, filling the imbalance and potentially triggering the next upward leg. Fair value gaps often serve as magnet zones in trending markets, and in this case, could offer a key entry point for those looking to position long within the larger bullish structure.
Liquidity Levels
One of the more critical areas to watch lies around the $111,000 level, where we see a double top on the lower timeframes. This region holds a significant amount of resting liquidity just above it, as evidenced by the liquidation heatmap. These clustered stop-loss orders and leveraged positions create a liquidity pool that could attract market makers and large players looking to trigger a stop run. As price approaches this level, it becomes increasingly likely that the market may spike into this liquidity before deciding on a longer-term direction. This liquidity zone acts like a magnet and is a common target for short-term wicks and fake-out moves.
Expectations
The current expectation is for Bitcoin to push higher toward the $111,000 level before the market makes a more definitive move. While this upside continuation seems likely in the short term, caution is warranted, especially considering the structure on higher timeframes. The weekly chart is starting to show some signs of exhaustion, with momentum slowing and potential bearish divergence forming. As such, the move to $111,000 could simply be a liquidity grab—a final push to trap breakout traders—before a deeper correction or reversal unfolds. If price does manage to break the all-time high with convincing volume and sustained follow-through, the bullish case would strengthen significantly. Until then, however, it’s important to remain cautious and recognize the risk of a fake-out at these elevated levels.
Conclusion
Despite the strong rally in recent weeks, Bitcoin still faces substantial resistance overhead. The $111,000 level stands out as a critical zone that could act as a magnet, drawing in price action before reversing to the downside. This area is not only technically significant but also loaded with liquidity, increasing the risk of a bull trap. Traders should remain vigilant and avoid getting caught on the wrong side of the move. Watch closely for signs of exhaustion or divergence as price approaches this level, and be prepared for potential fake-outs designed to lure in overly aggressive participants. Staying patient and waiting for confirmation remains the most prudent strategy in this environment.
-------------------------------
Disclosure: I am part of Trade Nation's Influencer program and receive a monthly fee for using their TradingView charts in my analysis.
Thanks for your support.
- Make sure to follow me so you don't miss out on the next analysis!
- Drop a like and leave a comment!
Trade active
Still waiting for price to move🔸 Free trading Discord
discord.gg/fVfJHHQSMG
🔹 Free trading signals
t.me/CandleCollective
discord.gg/fVfJHHQSMG
🔹 Free trading signals
t.me/CandleCollective
Related publications
Disclaimer
The information and publications are not meant to be, and do not constitute, financial, investment, trading, or other types of advice or recommendations supplied or endorsed by TradingView. Read more in the Terms of Use.
🔸 Free trading Discord
discord.gg/fVfJHHQSMG
🔹 Free trading signals
t.me/CandleCollective
discord.gg/fVfJHHQSMG
🔹 Free trading signals
t.me/CandleCollective
Related publications
Disclaimer
The information and publications are not meant to be, and do not constitute, financial, investment, trading, or other types of advice or recommendations supplied or endorsed by TradingView. Read more in the Terms of Use.